The aim of this product is to highlight some interesting charts that support our current views, challenge the consensual view or are simply just interesting to share. As always, if you ever have any questions then feel free to reach out.
1. The oil industry needs an ambitious retirement plan: The chart below is interesting in the context of this paper published by Daniel Litvin, the founder of Critical Resource, advising energy and resource companies on climate, ESG and geopolitical risk. He suggests the sector needs to develop a disclosure standard for current and projected emissions, while also developing its own methodology for individual companies to ensure that their climate plans are aligned with global emissions-reduction goals. Thirdly, the industry should look to underpin the winding down of oil and gas through some sort of collaborative mechanism to limit global output, backed by governments.
If you find our work valuable, please like, subscribe and share. We rely on that to grow our subscriber base. This is real analysis by real analysts. Enjoy!
2. How to create effective carbon pricing schemes: As you can see from the below chart, current carbon prices differ from geography to geography and as Alliance argue in this paper, are far from levels and coverage required. The paper goes through key features carbon pricing schemes should have and the need to create a more globalised scheme. The creation and implementation of many emission reduction technologies in high-emitting sectors depends on adequate carbon-pricing and other regulations to promote better outcomes across industries.
3. ESG outperformance set to end? While this will certainly ruffle a few feathers, Abraham Lioui, professor of finance at Edhec Business School and an expert in the strategy of investing according to good environmental, social and governance principles, believes he and his co-authors have found signs that the ESG market is reaching maturity and could become a victim of its own success. Abraham Lioui and his fellow academics found that according to most data sets, the accumulated alpha, or outperformance, for the E and S pillars of ESG was above 1 percentage point per year, “However, we identify a downward sloping pattern in this outperformance,” he said.
The KnowHow Capital Portfolio is now live. Subscriber access only below.
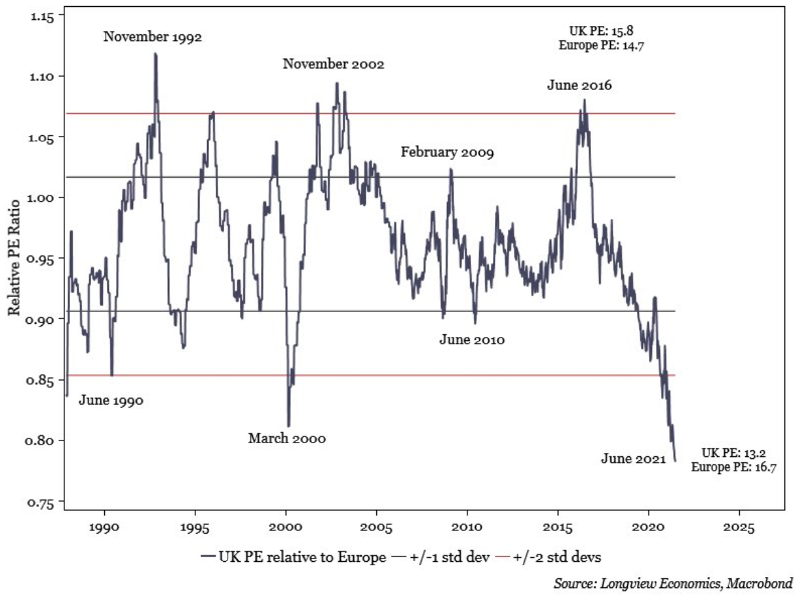
4. UK discount to Europe and the US at all-time lows: Our readers will already know our view on the UK and why it deserves all the interest it is getting from PE and this chart below highlights just how extreme the discount vs Europe and the S&P is. Versus Europe, the relative discount has now exceeded the last record back in March 2000. Versus the US, we continue to break new records. While the make-up of the FTSE can part explain this, the size of the move in deviations is very interesting. We have a screen of UK M&A candidates if you would like to see it, slide into our DM’s.
5. Pressure from supply chains on inflation keeps building: Thanks to @RobinBrooksIIF for this one. As he points out, pressure from supply chains on inflation keeps building. Charts show mark-ups firms charge on output over input prices (vertical) vs supplier delivery times (horizontal) from March - June. The correlation keeps rising. We've never seen this kind of a globalized supply shock...
Our analysis of Nike, Adidas and Lululemon’s social question is one of our most read reports this year. Subscriber access below.
6. Bond yields and tech stocks echo ‘extreme anomalies’ of dot-com boom: While we are on the topic of extremes, the relationship between high-flying technology stocks and U.S. Treasury yields has broken down, echoing ‘the extreme anomalies of the dot-com boom when tech valuations became unmoored,” according to Morgan Stanley. For most of the last 20 years, tech stocks have traded directionally with economic growth—carrying a positive correlation with long-duration Treasury yields—as investors viewed them as tied to positive economic growth,” Lisa Shalett, chief investment officer of Morgan Stanley’s wealth management business, said in a report this week.
M&A has been on a tear in 2021 but there is still more to go for. What’s driving it and where are the upcoming opportunities? Subscriber access only below
7. Are meme stocks entering a bear market? While we try and steer clear of getting involved in the meme world, this chart from Bloomberg was interesting. A basket of retail traders’ favourite stocks is tumbling close to a bear-market plunge of 20% as investors shun the most speculative equities for safer bets. The group of 37 so-called meme stocks tracked by Bloomberg fell 2.6% on Thursday, extending its retreat from a June 8 high to just shy of 20%. The basket bounced off its 50-day moving average, a level it hasn’t closed below since late May when a massive surge in AMC Entertainment Holdings Inc. captivated investors.
8. China tech firm selloff may be far from over: Our comments earlier on in the week on why we haven’t added #BABA to our portfolio, even though it looks particularly attractive from a valuation perspective caused a real stir. With that in mind, it is interesting to read this article on Bloomberg. The questions from many investors are twofold. (1) When are the valuations too attractive to ignore? (2) When will the Chinese govt pressure abate? For Paul Pong, managing director at Pegasus, he sees selling pressure continuing as measures from the authorities continue.
9. VC space breaking record after record: No matter which way you cut the data (and this report from CB Insights has cut the data a ton of different ways), the money piling into the Venture Capital space and the results this is happening is breaking new records every quarter. Q2'21 saw the birth of 136 new unicorns globally, nearly 6x the 23 unicorns born a year ago in Q2'20, and already higher than the 128 unicorns born in all of 2020. This paper from Pitchbook, published Thursday, is also very insightful in looking at how non-traditional investors are ramping up deal activity.
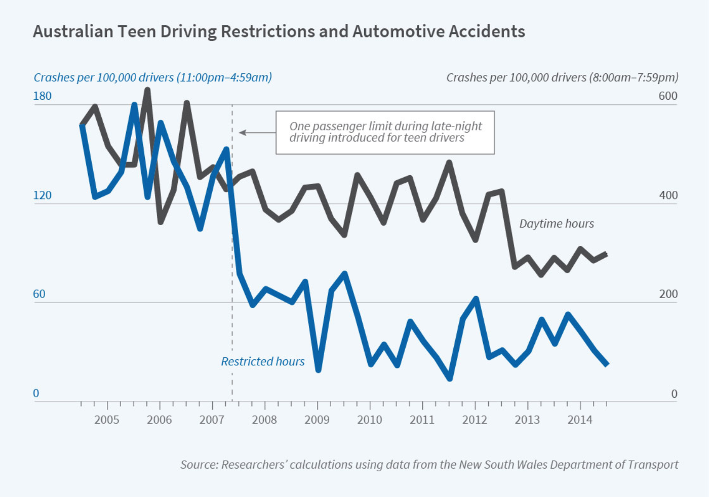
10. Can we learn from the Australians on teenagers driving mishaps? This is not finance related, but we thought this chart was fascinating. Yes there will be pushback that this doesn’t take into account increased vehicle reliability, but the results are still pretty striking. A policy in Australia that has banned late night and early morning driving by first-year drivers reduced crashes and fatalities by more than half and still has ongoing benefits in later years.


