Please give us a like on Substack if you find our work valuable. It helps us enormously. This is real analysis by real analysts. Enjoy!
In today’s KnowHow…
Growth reset done… Part I
Accelerating the E in ESG
US proposed global corporation tax of 15%
World-Dominating superstar firms geting bigger, techy, and Chinese
What happened overnight…
It has been a volatile week in the markets, but Friday seems to be ending on a slightly more positive note. Stocks and US futures are in the green as investor optimism got a boost from strong economic data. European equities climbed as the Services PMI prints surprised to the upside at 55.1 vs forecasts of 52.5. As a reminder we spoke on what strong data in Europe could do to the USD in yesterday’s daily. On the single stock front, Richemont was the stand-out posting very strong results. Outside this, yields were little changed, and Gold hovered around its 4 month high.
Chart of the Day
This chart was doing the rounds yesterday from both crypto bulls and bears alike. Bulls will tell you drawdowns happen in bitcoin all the time… forget about it and buy more. Bears will say this drawdown could get a lot worse still and that this kind of volatility means bitcoin can never be considered a safe haven. Well, it takes two to make a market.
Analysis
Growth reset done… Part I
If you break down what drives stock prices, simplistically it is two things. The earnings trajectory of a business and the valuation or multiple the market is willing to assign that business. Nirvana is when we buy businesses on valuations and earnings that have substantial upside.
Rates matter during periods of uncertainty
Why do we obsess over rates and inflation expectations? Because it is a key input in market valuation. The chart below shows the correlation of the US 10yr yield vs the Nasdaq Comp PE multiple. If you have been obsessing over the US 10yr yield this year, appreciating the long-term correlation is important. Over the past few years, the correlation has almost always been negative i.e. rates go up multiples go down. Look out further and that has not always been the case.
Incidentally, it is the exact same relationship with the Dow Jones i.e. cyclical sectors. Growth stocks just wear a bigger brunt of the backlash given their higher multiple.
The important point is this however… during periods of extreme valuation (low and high) and macro uncertainty, that relationship is highly negative. As the charts show, those resets happen hard and fast.
Valuations have reset hard after recent volatility
Over the past week, that extreme negative correlation with multiples has started to ease. Yields have stabilised but as earnings upgrades have come through, so have valuations. The chart below would suggest that the valuation part of the growth reset is now largely complete. It’s over to earnings now.
What we’re reading
Accelerating the E in ESG
If you’re scratching your head wondering what ESG stands for, then my god, where have you been? Putting aside crazy growth, ESG has been the biggest driver for active equity flows in the past few years. And it’s becoming even bigger. A few weeks ago we kicked off the launch of our ESG product with our note: ESG is Coming to America. We’ll be bringing more over the coming weeks for paid subscribers.
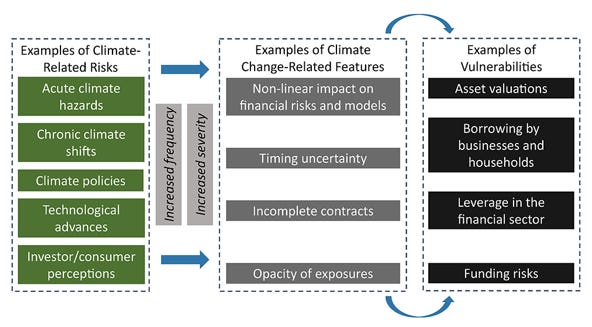
Yesterday, the Biden administration asked federal agencies to put together a complete government wide climate strategy plan within 120 days. That in itself isn’t particularly surprising, it was part of their campaign focus and is part of an accelerated global agenda. What it means for businesses is harder to quantify but ultimately it will lead to a tightening of capital flows to industries and businesses that don’t comply and encourage flows to those that do. In March, the Fed published its climate report and the EU followed suit in its Financial Stability Report this week. The below from the Fed’s report is a helpful framework for some of the tail risks businesses are potentially exposed to.
US proposed global corporation tax of 15%
Joe Biden seems to be the theme of the day today in the Daily KnowHow. The news overnight is that the Biden administration has signalled it will accept a 15 per cent global minimum tax on large multinational companies, in international talks aimed at increasing revenues from corporations that operate across borders. US officials have been meeting with negotiators from countries taking part in OECD talks this week to discuss what that minimum tax rate should be. The Biden administration had previously proposed 21 per cent, according to the US Treasury but it seems like they have moved down to 15%. As you can see from the chart below, only a few countries actually have a tax rate below 15%. In comparison, at 21%, a number of other countries including the UK would have been impacted so it is a bit of a step-down from the Biden administration this.
World-Dominating Superstar Firms Get Bigger, Techier, and More Chinese
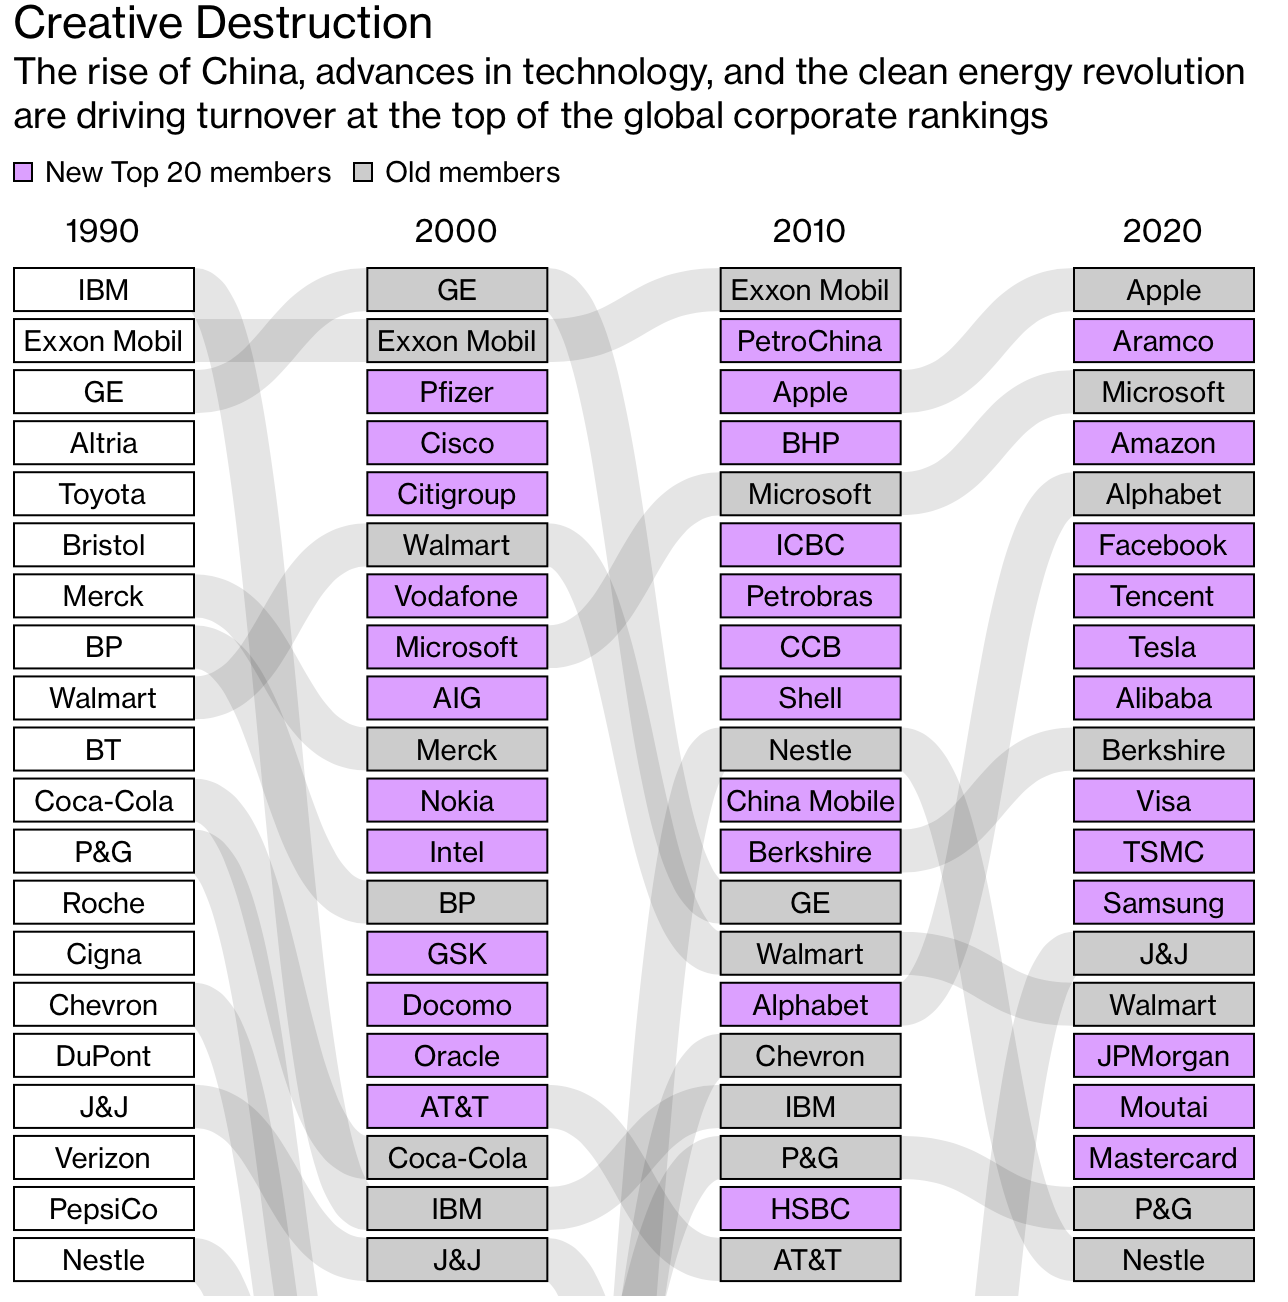
While this is by no means new news, this is a very interesting article looking at how the biggest firms in the world have changed since the 1990’s. The chart below looks at the moves over this period but what is really noticeable is that the top 50 companies by value added $4.5 trillion of stock market capitalization in 2020, taking their combined worth to about 28% of global gross domestic product. Three decades ago, the equivalent figure was less than 5%. On top of this, the biggest companies generally post fatter margins and pay less in taxes than they did in decades past. Their median effective tax rate of 35% in 1990 had dwindled to only 17% last year, while profit margins headed in the opposite direction, soaring from 7% to 18% over the same period. There are a number of worries that include, tax revenues for governments, employment levels as tech needs less workers and workers’ rights that could be at threat.


