Ask your question! Markets are tough at the moment and will remain so for a while. We had a question from Matthew B yesterday which we’re answering in today’s Daily KnowHow. How long could the growth to value rotation last? Please feel free to ask. We want to help your process and will try to dig into as many as we can. Chuck your questions in the comments or reply to the email. This is real analysis by real analysts. Enjoy!
In today’s KnowHow…
How long can this rotation go on for?
Can a sandwich tell you how the ‘Back to Work’ drive is going?
Seychelles case rates should raise alarm bells
British Spac king plans his first European blank cheque listing
Shorts are massing on Nasdaq
What happened overnight…
Inflation was once again the name of the game yesterday but the follow-through to the tech space was greater than we have seen in recent weeks (more below). As a result of the moves in the US and Asia (worst day since March), the European benchmark tumbled the most in one day since the turn of the year. But, interestingly in Europe, we had started to see more selling in cyclicals this morning. However, futures so far following a similar pattern to what we saw yesterday with Nasdaq again underperforming.
Chart of the Day
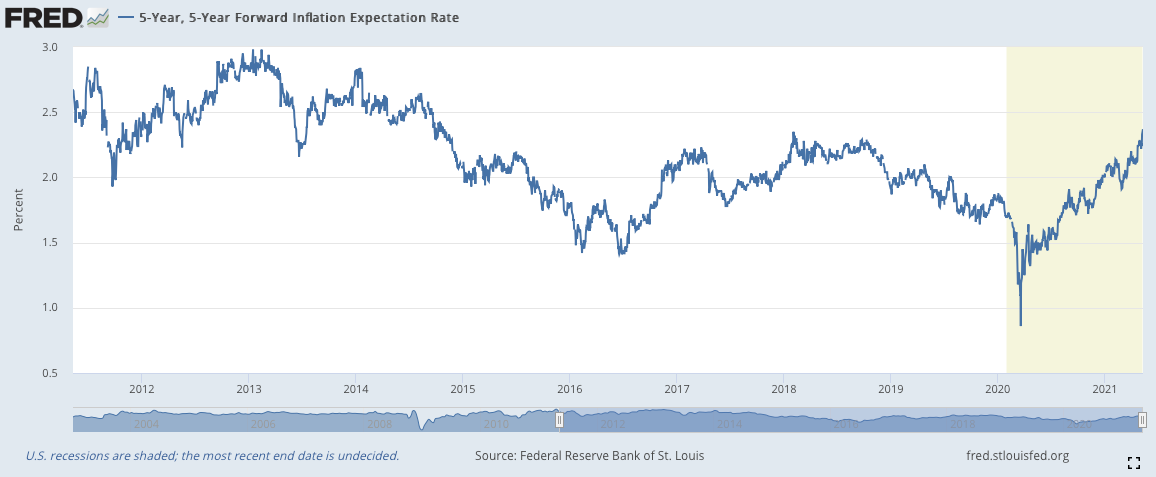
‘Tis the chart that has got everyone in a tizz. The US 5yr forward inflation rate. We really believing inflation expectations are now structurally the highest since 2014?
Analysis
How long could the growth to value rotation last?
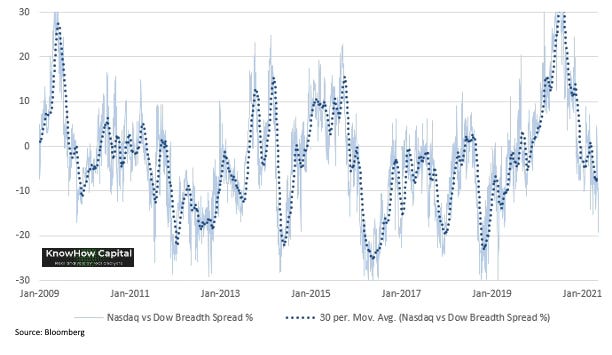
If a year ago, someone had said to you that cyclicals would outperform growth or tech stocks over the next 12 months, you would probably rightly have laughed in their face. Vaccines were still an uncertainty, lockdowns still largely in place and whilst you could be hopeful that things would improve, there certainly wasn’t any clear path to that improvement. Well, look at the chart below… after yesterday’s move, that is exactly what has happened.
What’s driven the rotation?
We’ve discussed the rotation at some length through previous Daily KnowHows but simplistically, it is a function of two things: i) improving earnings trajectory for cyclical stocks as the market anticipates an economic recovery, and ii) expectations for rising inflation and therefore interest rates impacting longer duration growth stocks.
It follows from the above that in order to see a stabilisation in the rotation, we need to see positive economic surprises and inflation expectations to ease. We’ll be discussing that in this week’s Equity Strategy note. But for now, to answer Matthew’s question, we’re focusing on the breadth of the rotation.
Rotation has accelerated in the past two weeks
The below chart is for the Nasdaq vs Dow Jones. After yesterday’s move, the breadth spread is starting to look extended but its not extreme. That is in part due to a point we have made in previous notes, that Big Tech actually screens relatively good value at the moment with cyclical upside also.
If you look at the rotation on the basis of S&P Growth vs S&P Value, you will see that it looks more extended and on a par with what we saw post the China Stock Market Crisis in 2015.
Our view, since early April has been that short-term we think the growth to value rotation has run it’s course. That’s clearly been wrong. The surge in commodity prices has surprised us and supply chain issues are clearly pushing investors to bet even harder on a cyclical recovery. We remain skeptical.
How much further to go?
Below, we have overlaid the Nasdaq vs Dow chart with the post-financial crisis rotation that started in Mar-09. Then, the initial sharp rotation played out over 3 months and was largely complete by Nov-09 as the market started to lose confidence in the recovery. We still expect to see a similar pattern through 2021.
What we’re reading
Can a sandwich tell you how the ‘Back to Work’ drive is going?
If you, like us, are data geeks and love tracking random data points then look no further than the ‘Pret Index’. Pret is providing weekly data to Bloomberg about its transaction volume across the country to provide one look at how the U.K. is getting back to normal. The Index is calculated against a baseline from January 2020, before the pandemic hit the U.K., and compares transaction data from March 8th—the week before schools reopened in England—against the average from that month. Every point (.01) on the index represents 1% progress towards returning to those January 2020 levels. The Key Conclusion? While some areas of the country are getting back to normal sandwich eating levels, central London’s recovery is far slower….
Seychelles case rates should raise alarm bells
Two weeks ago we looked at a couple of news reports around the Chile vaccination program and an April spike in cases. Despite having the highest vaccination rate in Latam, with 90% of vaccines being China’s Sinovac, there were concerns around efficacy and new variants. Cases in Chile have subsequently eased but remain high.
The media focus has now shifted to Seychelles, the most vaccinated country in the world. There, the vaccines have been predominantly a mix of China’s Sinopharm and the UK’s AstraZeneca. But cases are surging. This is worrying for a few macro reasons:
vaccine diplomacy has been a big foreign relations focus for China post-pandemic. There will inevitably be more tit-for-tat in the coming weeks ahead of the G7
Sinopharm is only 40% of vaccines. AstraZeneca is the remainder. hmm…
it’s a stinker for travel and tourism. 10% of new cases in Seychelles are tourists. Governments will be uber careful on borders
British Spac king plans his first European blank cheque listing
The recent €500m SPAC offering by LVMH chief executive Bernard Arnault and former UniCredit chief Jean Pierre Mustier was successfully listed in Europe and this, in our view, paved the way for more European listed Spacs. With that in mind, it is interesting to see Ian Osborne, the British investor at the forefront of the US Spac boom, is turning to Europe with new plans. Hedosophia, the fund manager run by Osborne, a publicity-shy tech financier and former political fixer, plans to raise €400m for a special purpose acquisition company in Amsterdam to target a European tech “unicorn”.
In an attempt to make its first European venture more investor friendly, Hedosophia has revamped the structure of the Spac. Under terms put to investors, management will be initially limited to 10 per cent of the so-called promote shares, and then an additional 5 per cent if stocks rise from an initial price of €10 to €20, €25 and €30 on a sustained trading basis.
Rout Lands on Nasdaq Where Shorts Are Massing, Bulls Getting Out
The breadth of the tech plunge is proving painful for bulls. Cathie Wood’s ARK Innovation ETF (ticker ARKK) sank 5.2% to the lowest since November. ARKK has dropped 16% so far this year. But damage wasn’t limited to tech’s speculative fringe. The New York Stock Exchange FANG Index fell 3.6%, putting the gauge on track for its worst month since March 2020.
This piece from Bloomberg summarises the moves yesterday very well and I thought it was interesting to see that short interest on the biggest ETF tracking the Nasdaq 100, or QQQ, increased to 3.6% of the stock outstanding, the highest level since August and up from 0.9% in December.


