In case you missed some of our work this week, here’s a quick recap:
The year of volatility
Measuring retail investor positioning
Are we seeing an Ag “supercycle”?
And that’s why valuation matters
The year of volatility
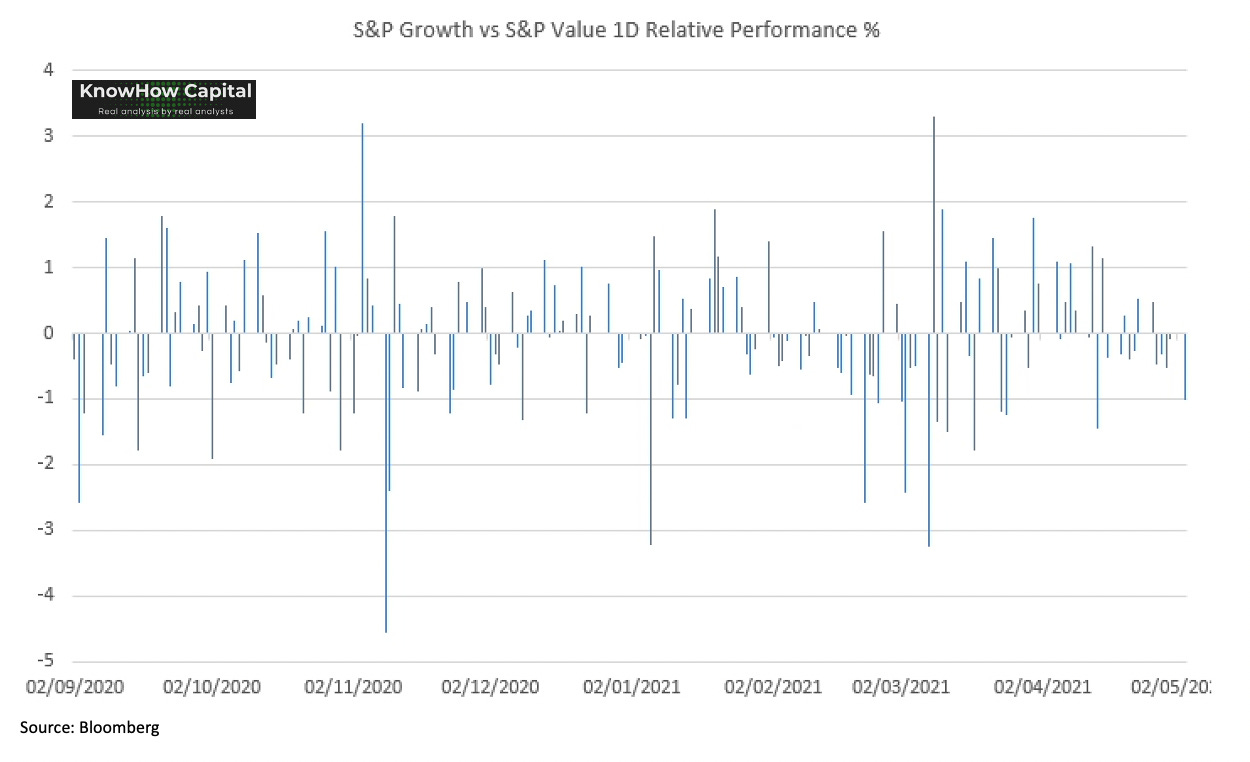
If you like your factoids as much as we do at KnowHow Cap, you’ll appreciate this one. Monday’s growth-value “pain trade”, a theme that’s continued for much of this week, was the 29th time this year that we have seen a more than 1% relative move in either direction for growth stocks or value stocks. Not impressed? Here’s another one. At this point last year, pandemic ‘n all, we had only seen 20 such moves.
In terms of overall size, looking at the S&P Value vs S&P Growth, the move was barely over 1%, so it was hardly all that dramatic as the below chart shows. However, these moves are becoming more concentrated around positioning. They are and will keep feeling increasingly more painful until concentration and positioning eases up.
Measuring retail investor positioning
To what extent has retail investor activity and potential switching into crypto driven the recent sell-off in growth stocks? The chart below suggests there is some logic to that argument.
Our preferred gauge of speculative retail activity is to look at the derivative market and smaller contract option activity or overall option activity. Have a look at the below chart from GS at this time last year. It clearly demonstrates a trend of rising retail investor participation that has accelerated post-pandemic.
The heightened volatility in this market means understanding sentiment and positioning in individual stocks is a crucial factor in deciding when to invest. This is particularly true lower down the market cap spectrum.
Teladoc has been a FinTwit favourite post-pandemic with a high and rising level of call option activity. We think this has contributed to a high degree of volatility and some brutal price action since February.
A more recent FinTwit favourite is Palantir, set to report earnings next week. Once again, we see a very similar pattern of rising call option activity.
Are we seeing an Ag “supercycle”?
2021 has been a year of decade long highs in commodities with agriculture on everyone’s radar. Demand will likely continue to outweigh supply as China continues its current import strategy, consumers eat out more after a year of lockdowns while supply is currently impacted by the Brazilian drought. Key agricultural commodities including grains, oilseeds, sugar and dairy have also jumped, with corn prices above $7 a bushel for the first time in eight years.
Key Developments:
We’re focusing in on Corn but this is equally the case for Soy, oilseeds, sugar and dairy as mentioned above. As you can see in the chart below the price of corn has almost doubled this year. The main driver of this is China after moving to a free market policy a few years ago. In the past, it has imported c7/8Mt of corn a year. This year, that number could be as large as 30Mt, nearly a fourfold increase in imports.
On top of this, we have seen a number of supply issues including storms in the US, droughts in Brazil and for the Safrinha crop. Supply is simply unable to keep up with demand with this theme likely to continue throughout 2021, into 2022.
The tightness is now impacting the wheat market which is a substitute for corn…
Will this continue?
While the points made above suggest that the Supply / Demand imbalance will remain and therefore support prices, tactically there are some concerns:
long / short ratios among Hedge Fund managers are elevated. We think positioning has already become extended and supported by speculation.
backwardation at these levels have historically reversed in the past with a sharp price fall
supply is coming on with hedging among producers at 25 year highs
What does this all mean?
We think there is a shakeout due. But, the big picture doesn’t change. The structural shift in the market driven by the Chinese free market reforms has raised the floor in Ag prices and in particular corn prices. Any pull back, is an opportunity to look for exposure. It’s a theme we like.
And that’s why valuation matters
If all you did this year was check-in now and again on how the headline equity indices were performing, you would have missed what has become the mother of all valuation tantrums. The ARKK ETF, a decent gauge of high growth and retail participation in our view, has been hammered while major indices, including the tech heavy Nasdaq, were all up yesterday.
All this should tell you two things: valuation and positioning matters. Excessive retail participation in high growth along with unsupported valuations and a rising rate cycle have left them dangerously exposed. We want to touch on how we’re thinking about valuation.
A case study through Pinterest
Below is the EV/Sales multiple for Pinterest. A company’s valuation multiple, on various metrics, will come down to a number of different factors both macro and micro. But, in essence, the trend is your gauge for how the market is viewing expectations for sales or earnings of that company. High multiple = high expectations, low multiple = low expectations.
In this second chart, we have overlaid that EV/Sales multiple with the change in analyst sales estimates over the next 12mths. Paying a high multiple for a stock following already high growth in sales estimates without any clear insight on the sales trend is when you start getting into valuation bubble territory. We like high growth, but we don’t like to play here.
Is that the bottom?
For Pinterest, and a few other high growth stocks, multiples have now retraced considerably back to trend. We think you can start making the case that valuation is now finally starting to look attractive.


