In case you missed some of our work this week, here’s a quick recap:
Keep your eyes on the VIX
How long could the growth to value rotation last?
Can the Nasdaq rally like its 2009?
Amazon does it cheaper
Assessing earnings momentum
Keep your eyes on the VIX
We’re pretty chilled out folks here at KnowHow, but there’s few things more irritating than someone pointing out that its “time in the market, not timing the market” when your portfolio is losing money. Can we just stop that pls!? Human psychology is such that we want to look at our portfolios regularly and that leads to complacency at the peaks and fear/uncertainty at the lows. Understanding your risk-reward and the macro paradigm at different points in the cycle are therefore important.
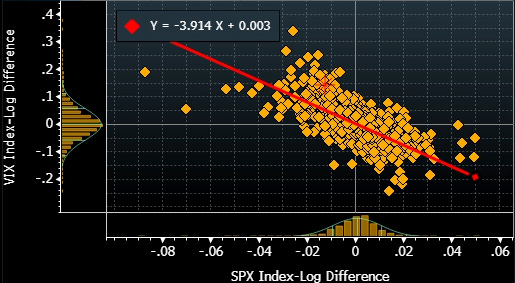
We use the Vix, volatility index, as one of our sentiment indicators. Below is the weekly relationship between the Vix and the S&P 500 over the last 40 years (Bloomberg). Vix goes up, S&P goes down and vice versa.
Does it matter if you’re thinking longer-term? 100%.
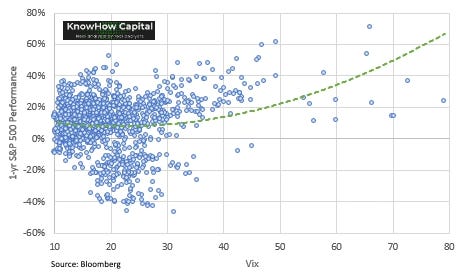
The chart below shows the 1yr performance of the S&P at different Vix levels. A VIX above 30 starts to substantially increase your investing risk-reward.
But, the relationship isn’t that straight forward. A high VIX has a very high probability of success but a low VIX also does as we show in the chart below. The problem is that uncertainty corridor between 20-30 where volatility is rising but the market is still hedging its bets. The risk-reward falls considerably. This week we have been hovering around those levels rather like Feb and March. This is not the time to get trigger happy.
How long could the growth to value rotation last?
If a year ago, someone had said to you that cyclicals would outperform growth or tech stocks over the next 12 months, you wouldn’t believe them. Vaccines were still an uncertainty, lockdowns still largely in place and whilst you could be hopeful that things would improve, there certainly wasn’t any clear path to that improvement. Well, that is exactly what has happened this week.
Rotation has accelerated in the past two weeks
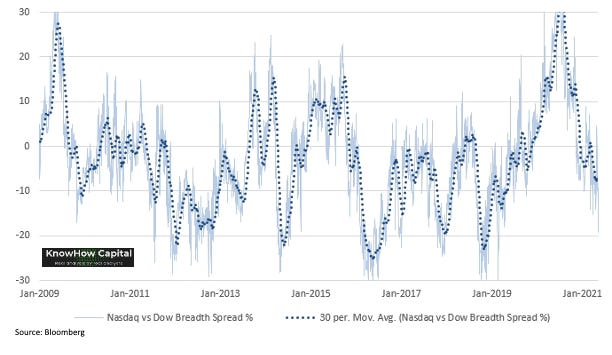
The below chart is for the Nasdaq vs Dow Jones. After yesterday’s move, the breadth spread is starting to look extended but its not extreme. That is in part because Big Tech actually screens relatively good value at the moment with cyclical upside also.
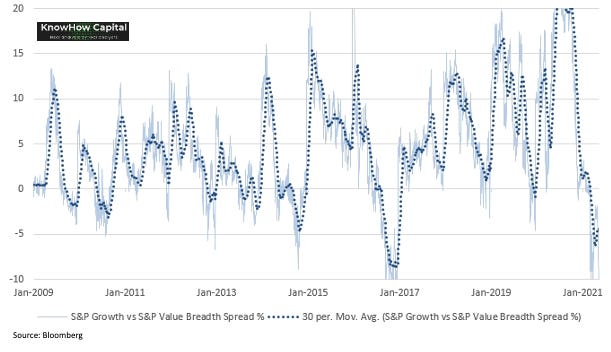
If you look at the rotation on the basis of S&P Growth vs S&P Value, you will see that it looks more extended and on a par with what we saw post the China Stock Market Crisis in 2015.
Our view, since early April has been that short-term we think the growth to value rotation has run it’s course. That’s clearly been wrong. The surge in commodity prices has surprised us and supply chain issues are clearly pushing investors to bet even harder on a cyclical recovery. We remain skeptical.
Can the Nasdaq rally like its 2009?
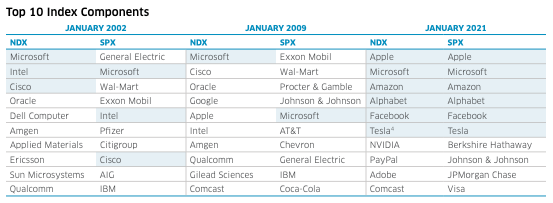
What’s interesting from the rotation charts above is how they are following a similar pattern to the post-GFC rotation in 2009. During that time, the Nasdaq doubled quickly from its lows and out-performed the Dow Jones soon after despite rising rates. But, the index composition is very different today versus then. And, unlike the financial crisis where the selling and earnings impact was largely indiscriminate, this time, a large number of Nasdaq constituents have been crisis winners. In fact, their earnings have accelerated through the pandemic.
Below, shows the performance of Nasdaq and Dow pre and post GFC and COVID. You’ll see we are starting off from a very different base today versus 2009 where the Nasdaq initially was playing catch-up at this point.
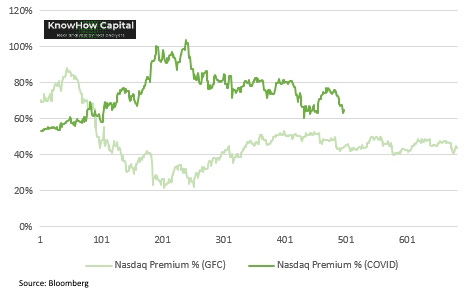
But, the earnings trajectory is only part of the story. The valuation premium of the Nasdaq vs. Dow on an EV/Sales basis has expanded considerably through the pandemic. During the GFC, the premium actually fell dramatically. Even after valuations went up, the premium remained well below pre-crisis levels. That valuation dynamic caps any 2009 like rally in the Nasdaq. But, we do think Big Tech is starting to look very good value again.
Amazon does it cheaper
The US grocery market stands at $1.3trn alone, with the global market worth over $12trn. Amazon’s purchase of Whole Foods in 2017 signalled the company was willing to venture into the sector and the recent ramp up in Amazon Fresh and more recently Amazon Go in the UK has signalled that the company is making a real push to disrupt the space.
The aim for Amazon is to be far more than just a grocery store. It is aiming to reinvent the grocery business according to a new set of rules with the aim to control the customer relationship, “ordering” end of the chain, and “delivery” end – and be much more flexible about how things are done in the middle. To contextualise this opportunity, if Amazon can increase their ‘Total Food and Bev’ market share to 10% vs the 1.9% in the below chart, the company could add over $100bn in additional sales just in this sector, not including any further cross-sell opportunities. All of a sudden, that does start to make a dent in Amazon’s overall revenues.
Will this be a success?
So, how does Amazon win? We think there are a few ways they can disrupt the market and potentially take share from direct competitors.
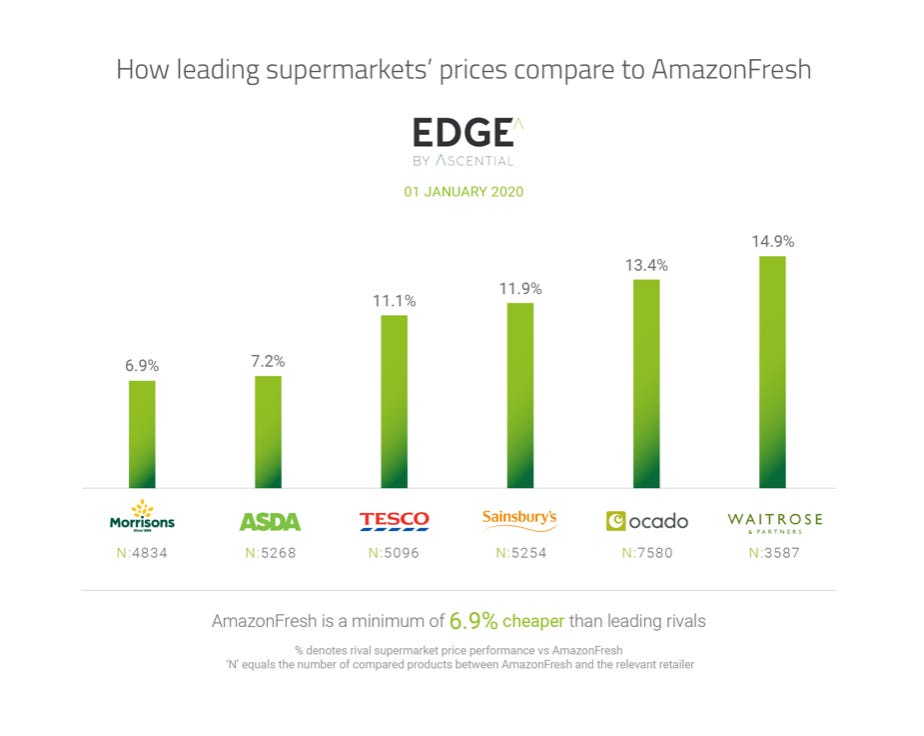
1. Pricing: through a technology led approach, Amazon should be able to drive efficiencies in both costs and revenues. This should give the company a competitive advantage from its peers. It is interesting to see that initial pricing comparisons from the Edge by Ascential study suggests this is already the case with Amazon prices at least 6.9% cheaper on average than leading UK supermarkets on branded products.
2. Multi-product sales: this is key. Amazon already has a stranglehold on the non-food retail space and it is interesting to see that many Amazon Fresh customers already add one or two high-margin non-food items to their baskets. This may not sound like much, but it can transform the economics of the basket size.
3. Subscription opportunity: the chart below highlights the huge opportunity Amazon has to drive cross-selling from their e-commerce business to the grocery business as the company continues to grow stores.
Conclusion: There is a long way to go for Amazon but they have the technology and ‘KnowHow’ to disrupt the grocery space and take share from the likes of Walmart in the US and Waitrose, Tesco and Sainsbury’s in the UK. There are of course other threats. The like of Instacart, DoorDash and other emerging operators in the booming rapid delivery app sector, which has attracted more than $14bn in venture capital over the past year. But, the runway is long and the prize big.
Assessing earnings momentum
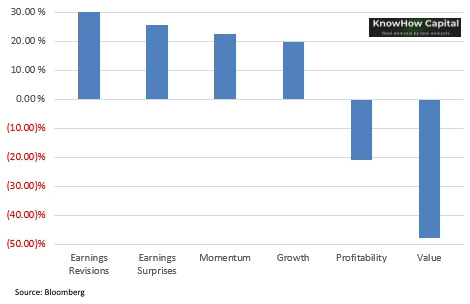
In case you have been sitting back in your cabana, sipping away at your martinis and trying to avoid the noise that is the stock market, it is worth remembering that earnings momentum/surprises have been the no.1 performing investing factor in the past 10 years.
In a world where central banks are piling in the liquidity and valuations are expensive across the board, performance is driven predominantly by companies that can keep upgrading earnings and surprising the market. If you think about it, it makes total sense. So, these charts matter.
Earnings recovery is broad
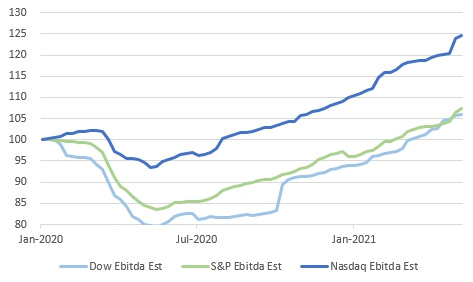
Below are the Ebitda estimates for the three major indices on a 12mth forward basis indexed to Jan-20 i.e. this is what sell-side analysts are expecting these indices to achieve in 12 mths time. The simple conclusion is that we continue to see positive earnings trajectory across all three indices.
Momentum through Q1 more varied
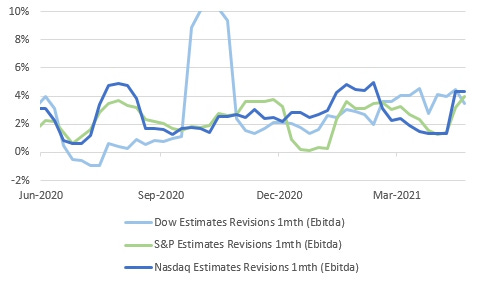
But, the market cares more about momentum than the actual level… this is where it gets interesting. If you look at the 2021 period in the below chart, you’ll see that Nasdaq revisions have been slowing down through this earnings period whilst the Dow, our proxy for cyclicals, has maintained decent momentum. That changed in the past couple of weeks for the Nasdaq.
In theory, that should suggest earnings momentum is shifting back towards tech and growthier stocks. Not quite. Whilst the cyclicals momentum has been fairly broad through this period, in the Nasdaq, it has been driven predominantly by Big Tech. To some extent, it has been the cyclical element of those businesses, advertising for Facebook and Google, that has driven earnings upgrades. Exclude Big Tech from the growth stocks and it looks like earnings momentum has stalled through Q1.


