In case you missed some of our work this week, here’s a quick recap:
Lessons from the Druck
Calling the top in equities…
Getting back to normal…
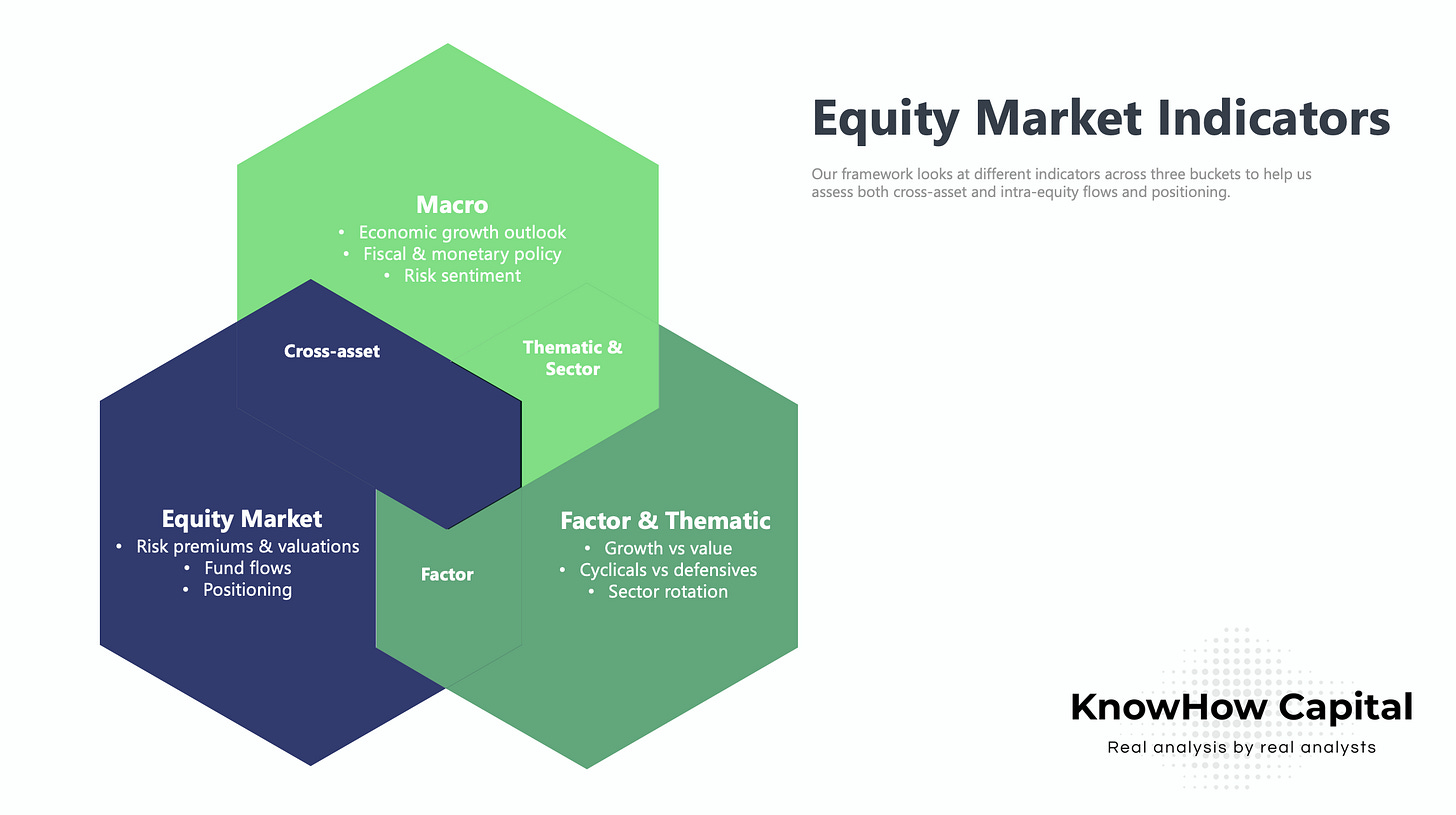
Our Equity Market Indicators publication for May is now live (here). Subscribe to access it.
Lessons from the Druck
Learning from great investors is an important ingredient in being a good investor yourself. In a social media, podcast and 24/7 news world, these investors are now more accessible than at anytime in history. Few have been as consistently great as former Quantum Fund manager, Stanley Druckenmiller. Following quite a few recent interviews, we have been thinking about how we would categorise his views as an investor.
Have a view on the macro
Like many successful hedge fund managers, Druckenmiller’s starting point is to try and define the current macro paradigm. That entails a few things:
what is the direction and size of economic growth short-term and medium-term?
what is the policy backdrop? both fiscal and monetary
what do the above mean for risk assets?
His comments recently have been particularly damming when it comes to Fed monetary policy. Last year, in the midst of the first COVID wave, the Druck was very much of the view that a recovery would be very long-dated. But, policy makers responded and his concerns have now shifted to how hot the economy is running.
Our central case is that inflation occurs, but we’re open-minded to something like ‘07-’08 when you never really got to the inflation because the bubble popped. So, inflation never got to the manifestation stage.
He has also been very vocal, he’s not the only one, about the potential for a continued de-basing in the US dollar as the Fed continues to backstop fiscal spending. That, will eventually lead to the US dollar losing reserve currency status and all the benefits that come with that.
What does it mean for investing?
Effectively, this macro backdrop assumes inflation and risk appetite runs too hot, fiscal spending continues at pace and when the Fed gets to tightening, it essentially pops a bubble. In that scenario, you would continue to invest in hard assets like commodities, cyclical equities that have pricing power and want some sort of dollar debasement hedge, traditionally gold or now bitcoin. You would also be very cautious on long duration assets, particularly growth equities where valuation multiples could continue to compress.
From a more philosophical perspective…
If you have been following our macro and equity strategy work over the past few months, you will know that our views are somewhat different. We aren’t convinced inflation will be sustained and there is still far too much slack in the global economy for central banks to step away any time soon. But, rather than focusing on differences in macro views, we wanted to touch on something more philosophical. However, rather than following the thought process of great investors blindly, it is important to understand that every investor’s strategy is dictated by their own knowledge base, access to resources, time frame and risk appetite. Druckenmiller and many great hedge fund investors will tell you that if the information changes they are very willing to change their mind. That is an important discipline for any investor… put aside emotion and ego, and be willing to accept when you’ve got something wrong. But, for most, being able to assess and respond to information as quickly as some of the great hedge fund investors isn’t really feasible. Below chart courtesy of Michael Batnick.
Calling the top in equities…
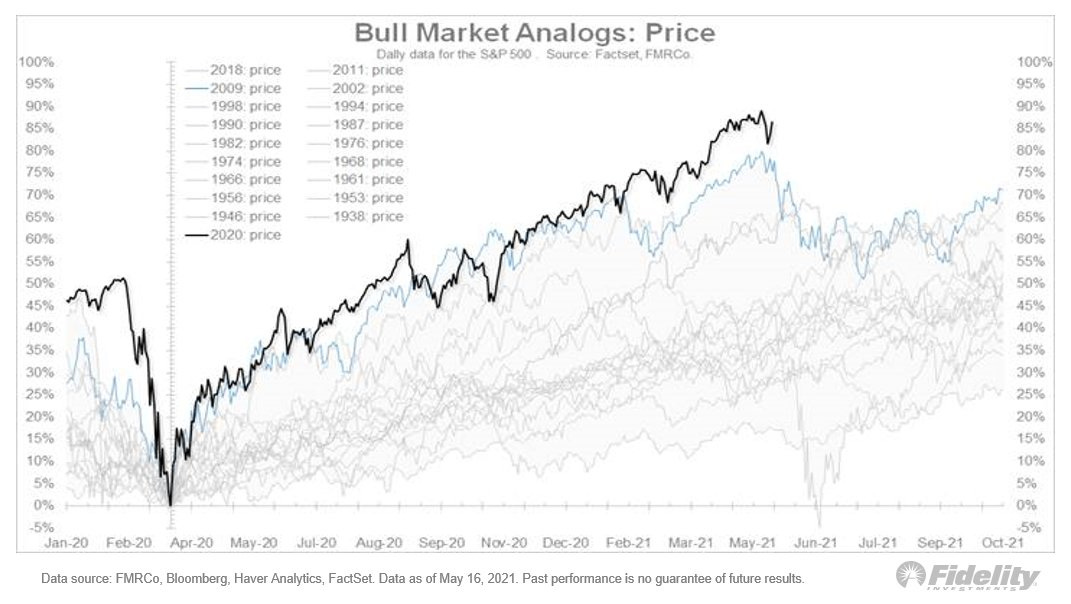
In our Equity Market Indicators report this week we discussed that whilst we remained positive in equities, we were mindful that we are entering the next phase of the rally. Equity market recoveries post-crisis typically follow a very consistent pattern. Below is a chart from the excellent Jurrien Timmer, Fidelity’s Head of Global Macro, that puts the current crisis in context versus previous corrections going back to 1938. It suggests a very similar pattern to what we saw in 2009.
If you breakdown what is happening under the bonnet, there are effectively a few phases of any recovery:
Phase 1 (Apr-Jul 2020): Phase 1 is driven largely by valuation discrepancies in quality growth businesses with good visibility despite the crisis.
Phase 2 (Jul to present): Phase 2 of the recovery sees greater market breadth with investors now anticipating an earnings recovery driven by an improving economic backdrop.
Typically, when economic leading indicators start to peak, particularly manufacturing indicators, we reach a consolidation phase or Phase 3 a couple of months later. As you’ll see from the chart below, this is particularly evident in value or cyclical stocks.
Essentially, the market has to juggle the fact that valuation multiples have already normalised and earnings momentum is now slowing. Plus, from a macro perspective some of the accommodative policy measures should start to be removed. That has repercussions for positioning and areas of the market that have attracted excess liquidity… watch out the memers!
Typically in that phase, value stocks will underperform (spread vs growth stocks below) but tightening of macro policy will also inevitably have an impact on longer duration growth names. Hence, phase 3 ends up with the market struggling to gain momentum and a short-term equity market top. We are not far from that point.
Getting back to normal…
Morticia Addams once said that “normal is an illusion. What is normal for the spider is chaos for the fly”. That’s also true in investing. What is normal to you as an investor depends on your style, experience, time in the market.
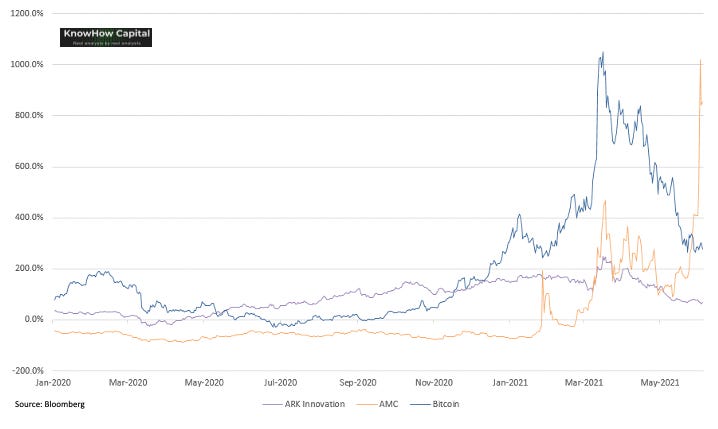
If you are a born in 2020 Twitterati or Redditor, then 2021 has been a little tougher. However, the Van Eck Buzz index would suggest that perhaps some level of normality is returning to your investing life. At least in the past few weeks…
If you are a fundamental investor and have been looking on at the AMC share price this week, the very idea that anything is “normal” in this market is probably totally laughable to you.
But, if you put aside what we have consistently referred to as the three bubbles in the above chart: hyper-growth, meme stocks and outside of equities, crypto, then actually, there is a little more normality returning under the bonnet.
As we discussed above, markets typically experience three phases in the first 12-18mths after a crisis. The final phase is consolidation when valuations have reached a new normal and earnings expectations have recovered. At that point, you should see performance of all the major factors start to converge. The above chart seems to suggest that is starting to play out.


Very informative analysis on what factors to consider when investing and following the markets