If you find our work valuable, please like, subscribe and share. We rely on that to grow our subscriber base. This is real analysis by real analysts. Enjoy!
In this week’s KnowHow:
The dot plot head-fake
The risk of peak data
The anatomy of Phase 3 through the ARK ETF
If you managed to watch Fed chair, Jay Powell’s, press conference on Wednesday, you would have seen a man at pains to point out that the changes in the Fed’s latest dot plot really weren’t all they were cracked up to be. The market has been on quite a rollercoaster since those projections were initially released on Wednesday afternoon, so let’s go through some of our conclusions.
The dot plot head-fake
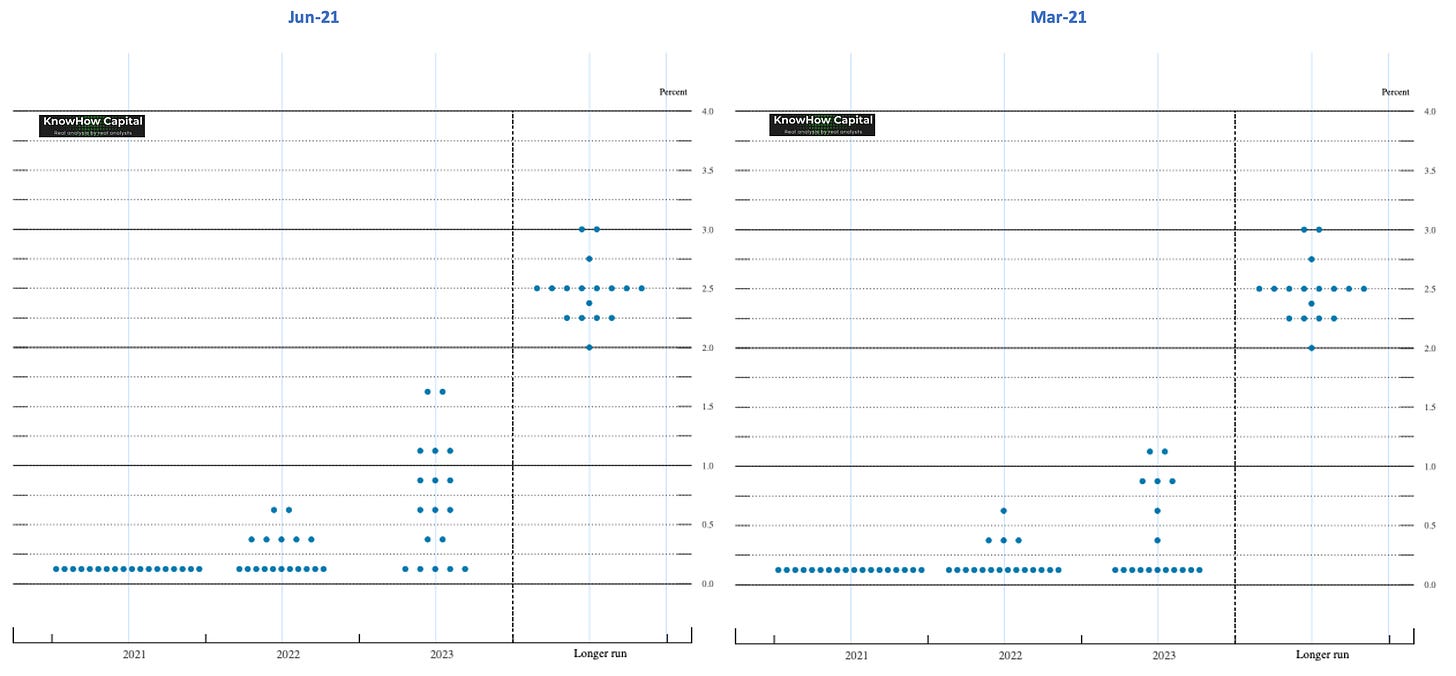
The famous Fed dot plot is essentially the interest rate projections of the 18 members of the FOMC published every quarter. The Fed uses the dot plot to communicate to the market it’s members’ views of where interest rates are likely to head in the coming years and long-term. Below, we have included both the June and March dot plots side by side. It essentially shows you two things: i) an increase in the number of members forecasting a rate move in 2022 and ii) an increase in the median projection for 2023.
The initial instinct of the market was to view the shift as uber-hawkish from the Fed. But, as we pointed out in our Tweet straight after, and Jay Powell highlighted in his press conference, that read is flawed for a couple of reasons:
Uncertainty: in periods of stable macro data, the dots are a good communicating mechanism for the Fed. But, we are not in a stable macro environment and visibility beyond a couple of quarters is limited. There is an obsession in mainstream media around headline inflation numbers but as we have discussed in the past, there is enough evidence from history that would suggest much of the commodity price driven inflation will prove transitory.
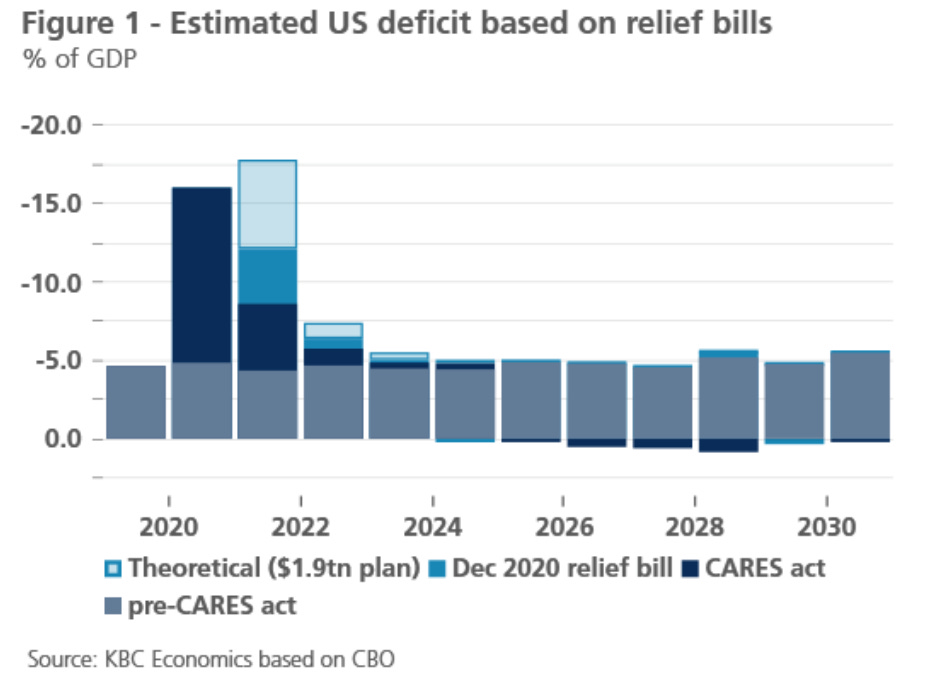
The 2022 Fiscal Cliff: a lot has been made of the Biden fiscal spending plans. They are clearly a net positive for growth. However, these are long-term spending plans that will play out over c.10yrs. What we have seen through 2020-21 is record amounts of upfront spending that will start to fall off towards the end of this year. Whichever way you cut it, 2022 will see a significant pull back in fiscal support and drag on GDP growth.
Tapering will dictate the path: the Fed is currently purchasing $120bn per month of assets split $80bn/$40bn across treasuries and mortgage-backed securities. For all intents and purposes, they are highly unlikely to raise rates whilst still making asset purchases. Their focus is rightly on managing the liquidity crunch rather than the path for long-term rates. And there, they have only just started “talking about, talking about” reducing accommodation.
The risk of peak data
Previously, we have discussed the three phases of market recoveries.
Phase 1 (Apr-Jul 2020): Phase 1 is driven largely by valuation discrepancies in quality growth businesses with good visibility despite the crisis.
Phase 2 (Jul to present): Phase 2 of the recovery sees greater market breadth with investors now anticipating an earnings recovery driven by an improving economic backdrop.
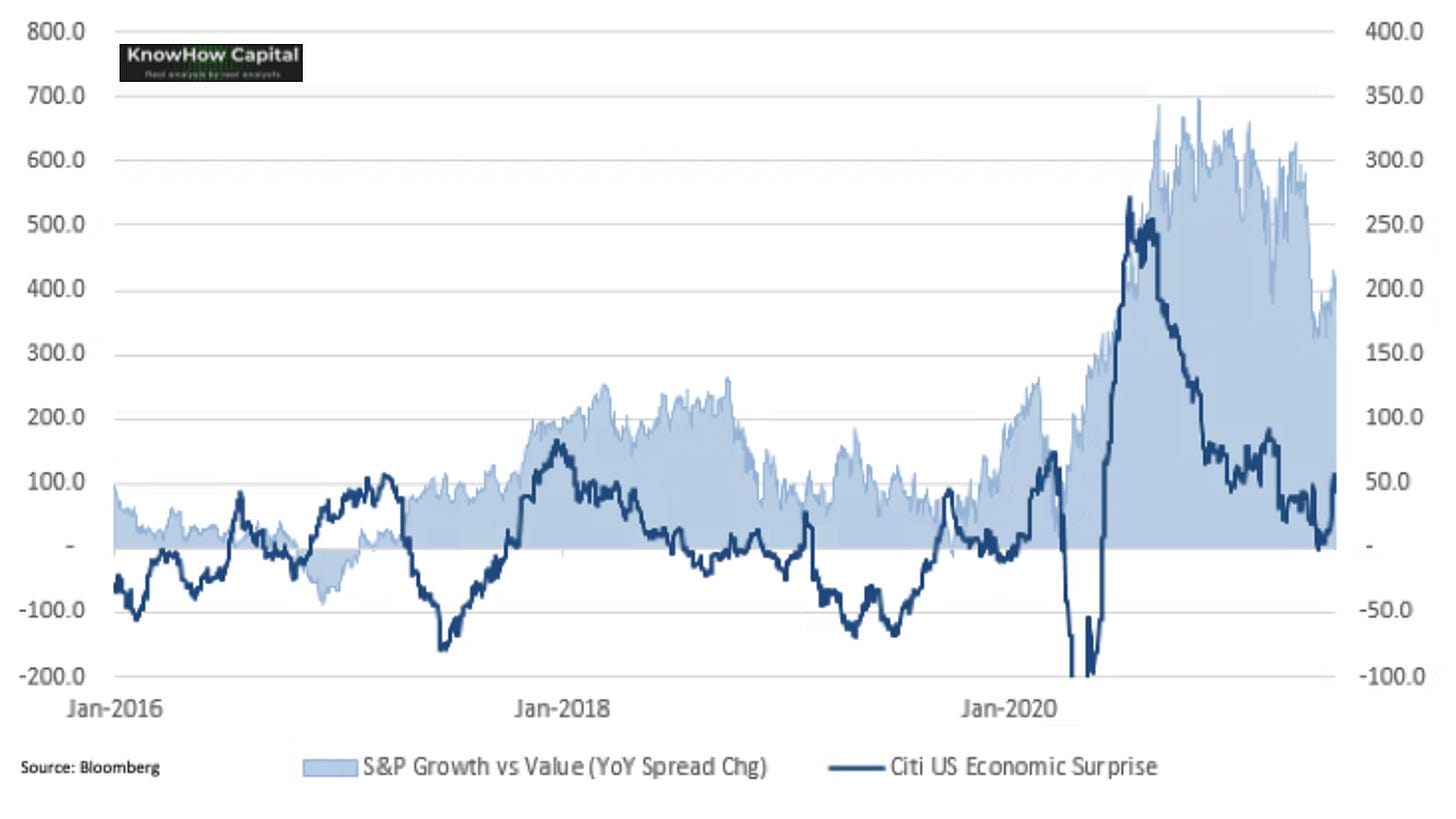
In the below chart, you’ll see how the positive momentum in economic surprises has correlated with the Growth vs Value trade. Cyclical stock analysts will typically use economic data and surprises in order to forecast earnings projections for stocks. As the economic surprises have started to wain in the last couple of months, the shift into cyclicals has also stalled.
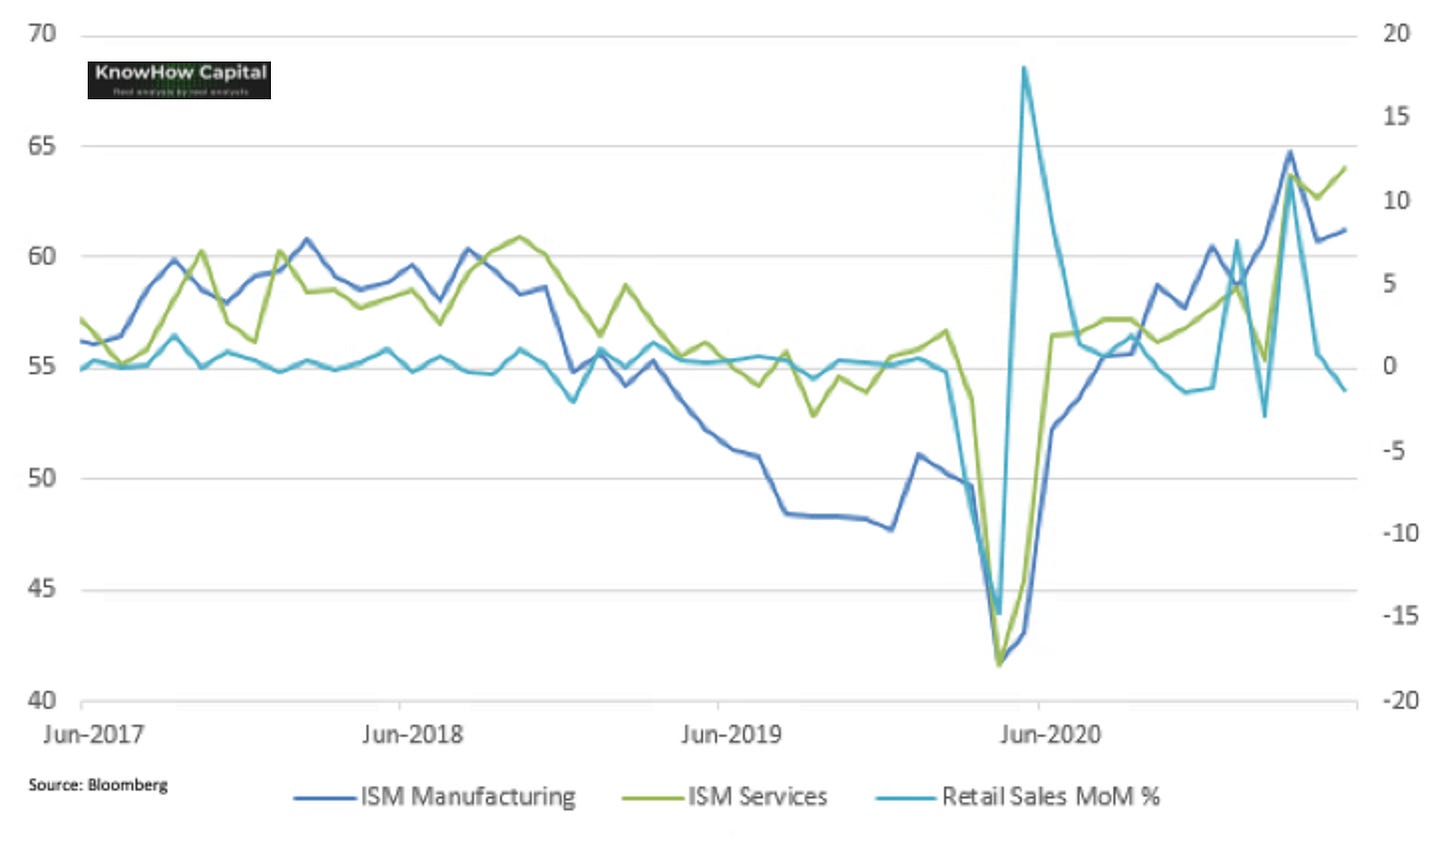
Typically, when economic data starts to peak, particularly manufacturing indicators, we reach a consolidation phase or Phase 3 a couple of months later. This week’s macro data across manufacturing, services and retail has fallen short of current projections. But, as you will see in the chart below, it is also increasingly suggesting that if we aren’t there already, we will be at peak data very soon.
The anatomy of Phase 3 through the ARK ETF
In Phase 3, we see limited scope for valuation multiples to expand. In fact, we would argue that the risk to valuations is still to the downside as the Fed toys with the idea of removing liquidity over the coming months. At the same time, we also see limited scope for cyclical businesses to benefit purely from the macro tailwind. We believe any market outperformance will therefore come from high quality businesses that continue to take share and can surprise positively on sales and earnings. Naturally, that leans us into more of a GARP mindset.
Over the past week, we have been delving into some of the highest profile factor and thematic ETFs to understand performance across valuation and earnings momentum. We think Cathie Wood’s ARKK ETF provides a decent case study into what has happened to valuation and earnings growth across a broad group of growth stocks, as well as the risks to high growth stocks that don’t deliver on earnings.
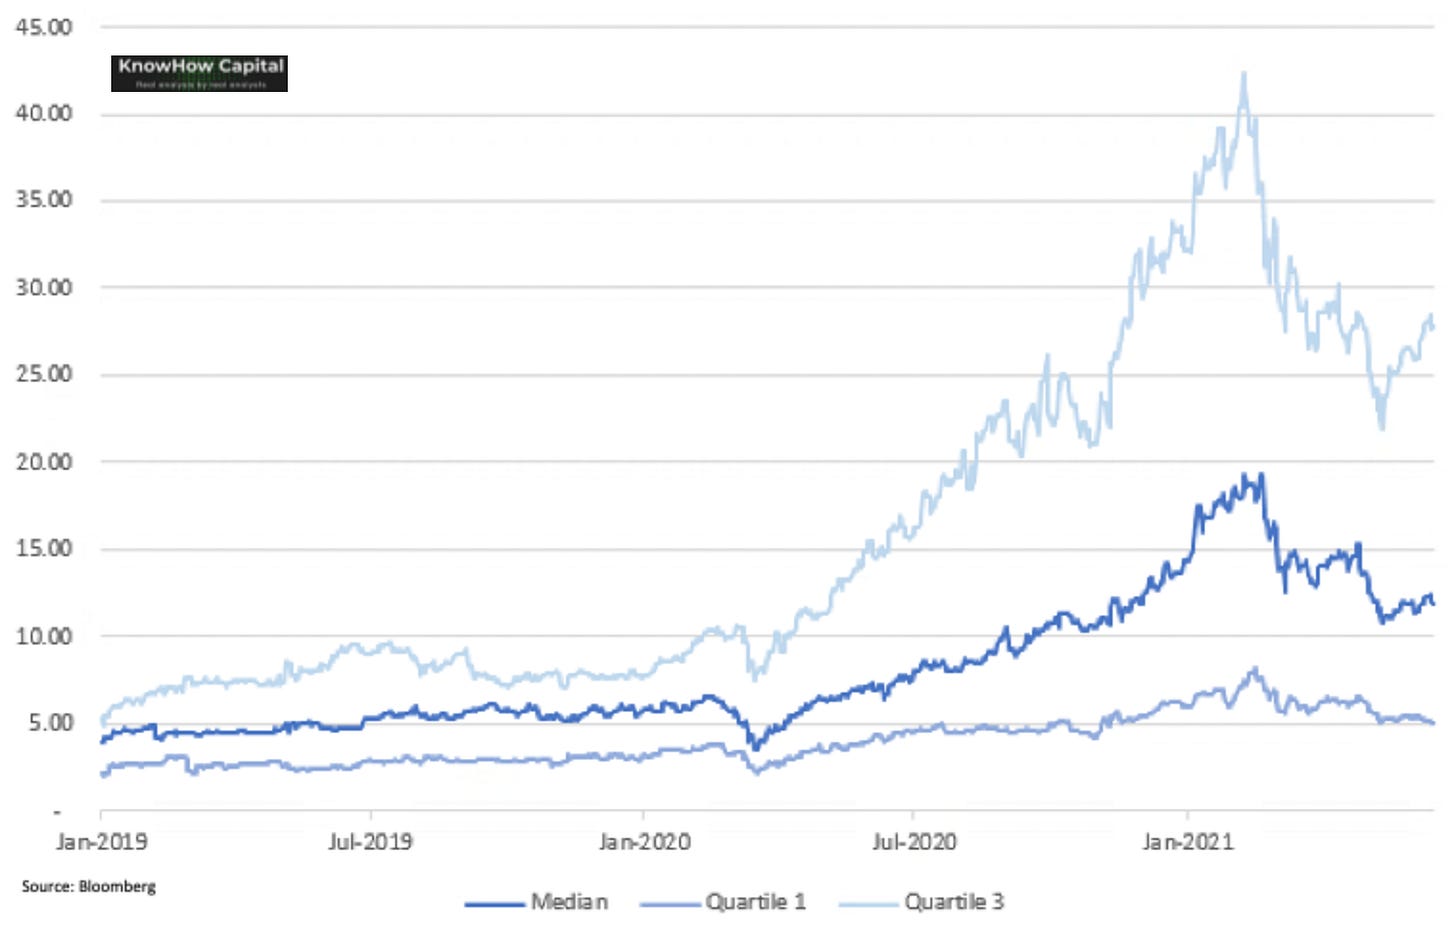
Below, is the ARKK ETF split by 1st and 3rd quartile as well as median EV/Sales multiples. Unsurprisingly, the top quartile i.e. the most expensive stocks, have seen significant valuation expansion post pandemic as digitalisation, disruption and cloud trends have accelerated.
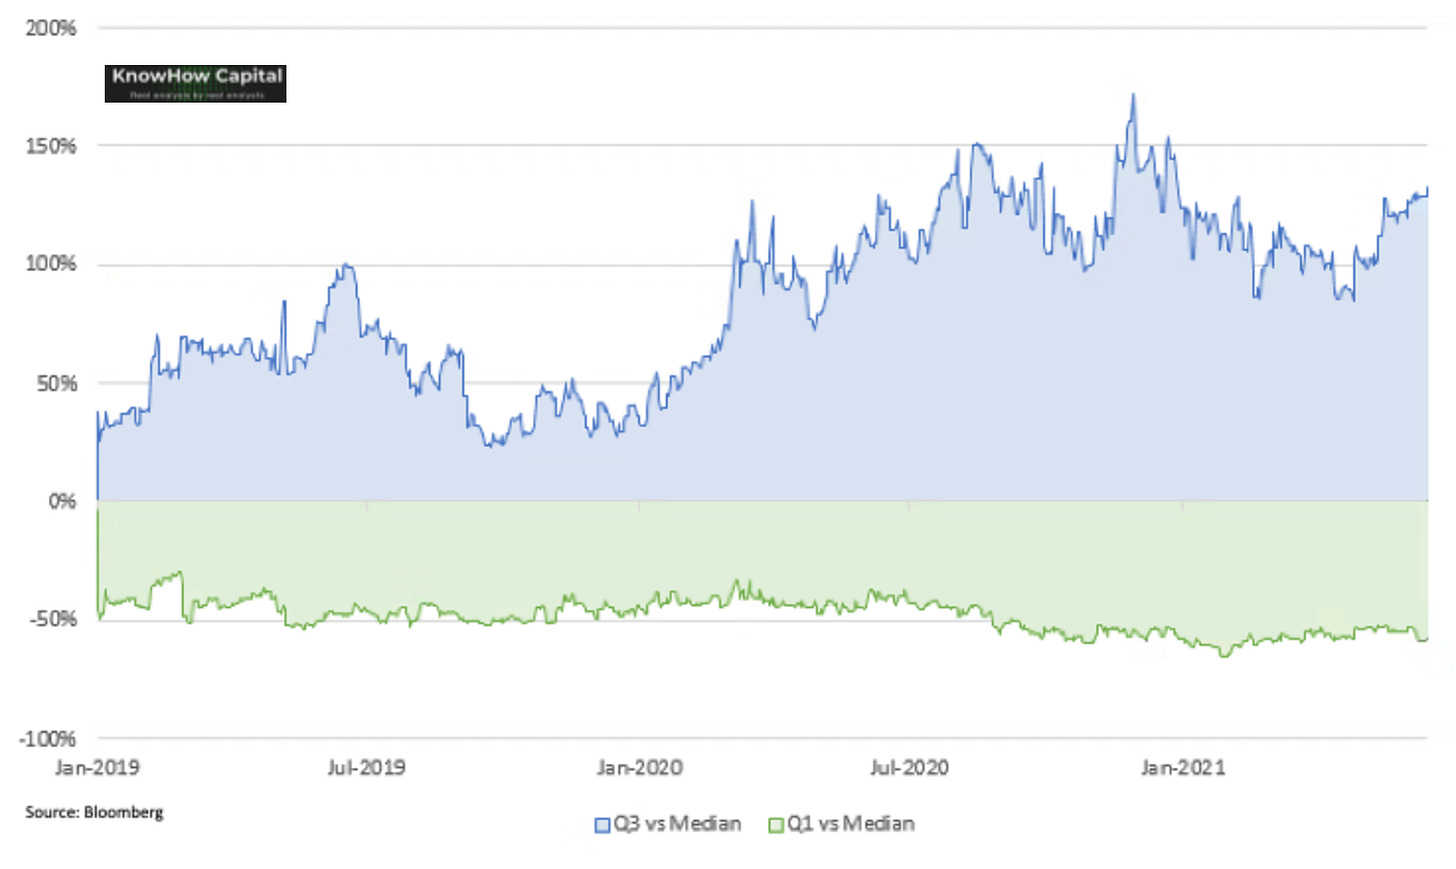
Despite the recent pullback in high growth stocks, the top quartile still trades at a >100% premium to median stocks (below chart), which remains a significant re-rating versus pre-pandemic levels. Meanwhile, the bottom quartile has seen it’s discount to the mean rise post-pandemic.
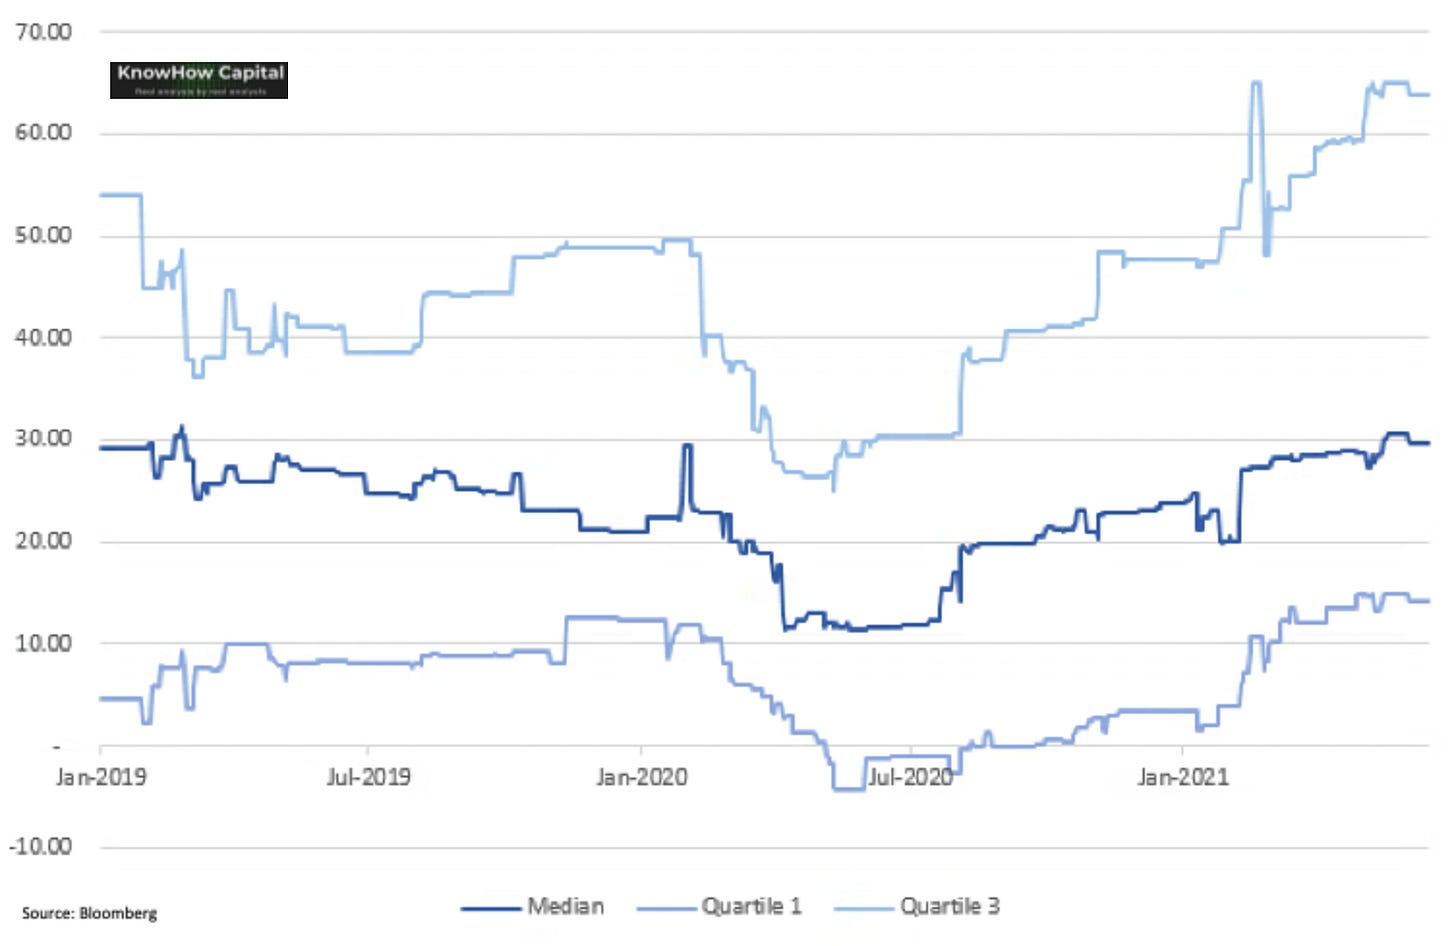
Of course, a big part of that valuation mismatch comes down to relative growth rates (below chart). The top quartile stocks are primarily COVID beneficiaries that have seen growth accelerating through the pandemic and in many cases continue to benefit from a structural shift. But, expectations remain elevated for many of these business. We have often highlighted Snowflake as a prime example of a high quality business where the stock is hamstrung by its valuation. Crowdstrike is another stock that has faced a similar challenge although the recent wave of cyber attacks and continued positive earnings momentum has meant the stock has now started to perform again.
However, if you dig into the bottom quartile, earnings growth is starting to recover to pre-pandemic levels and yet, valuation remains attractive. This is where we will be hunting over the coming weeks.


