We are approaching 1k readers. Thank you so much for your support. Please help us grow further by subscribing, sharing and Tweeting.
The Weekly KnowHow is sponsored by new company modelling platform Stellar Fusion. Dynamic company models built by real analysts to help you invest with knowledge. Sign up to get access on launch. Coming Soon!
In this Week’s KnowHow:
Companies continue to deliver against elevated expectations
Price action suggests otherwise
Case study in Pinterest, Twitter, Roku and Snap
We are now the bulk of the way through this quarter’s earnings season and for many it has been a painful experience. Even our KnowHow Capital Portfolio has seen its fair share of volatility. If we rewind back a few weeks, you will recall that we highlighted the below chart as a key risk, particularly for growth stocks. Expectations had started to rise again with both multiples and earnings estimates starting to look extended. The same trend prior to Q1 had resulted in a whole host of earnings downgrades.
Companies continue to deliver against elevated expectations
But, for earnings estimates at least, this quarter has been very different. The below chart is from the Refinitiv Lipper team showing that almost 84% of the S&P 500 has seen positive earnings revisions during earnings season. Every sector has seen more companies upgrading estimates than downgrading.
Price action suggests otherwise
Yet, the price action would suggest that the market has been far from impressed. We have shown below the 5 day price change post earnings versus the sales surprise for all the stocks in the S&P that have reported this quarter. You would be hard pressed to find a trend. That scatter gun price action is synonymous with a market that: i) wants to start differentiating hard between what it deems winners and losers and, ii) is uncomfortable with the valuation multiple on certain stocks. Given some of the headwinds we expect over the coming months from both peak data and peak earnings, that’s no bad thing.
The question becomes, how is the market differentiating between companies and assigning valuation multiples accordingly? Of course, the KPIs that investors will focus on will vary by sector. But, we have found the streaming and social media platforms to be an interesting case study in this valuation conundrum.
Case study in Pinterest, Twitter, Roku and Snap
The chart below shows active users in North America, as defined by each company, indexed to Q1’18. It is the weakness in the latest datapoint that has led to concerns for both Pinterest and Twitter that growth in the more easily monetisable US user has started to stall. Note, Pinterest management also decided not to provide user guidance for next quarter. That latest datapoint takes them back to pre-pandemic levels for monthly active users. That is clearly not ideal and raises questions about how sustainable the pandemic user-base uplift will turnout to be.
However, if you look at the average revenue per user in the US (chart below), it is clear that both SNAP and Pinterest standout in how well they have been able to improve the monetisation of customers post-pandemic. Our view, and we have said this on numerous occasions before, is that Pinterest is not like other social media platforms in that engagement is less frequent. That potentially leads to volatility in the user base. But, the pandemic has still led to very low cost customer acquisition and that customer will return when they need to access the product again eg. home renovations, weddings etc. Plus, there is a lot of innovation to come from both a product and monetisation perspective.
Roku and SNAP have continued to improve monetisation this quarter, while in Twitter’s case, the chart shows clearly why the company has been in the doghouse for the past few years.
What is most interesting in our view, is that despite the variation in revenue drivers i.e. user base growth versus ARPU growth, the earnings growth, as shown in the below chart, has been very similar across Pinterest, SNAP and Roku over the past couple of years. Twitter of course has tended to lag and both Roku and Pinterest have disappointed against elevated expectations this year.
Of course, it is important to remember that user growth clearly offers greater short-term earnings momentum than ARPU growth. But, user growth will also peak earlier particularly post pandemic when user penetration has been so high. Facebook and Google in particular show us that ARPU growth from an advertising perspective can compound for many years as the offline to digital advertising trend continues. If the product has a strong mousetrap, the ARPU runway is still significant.
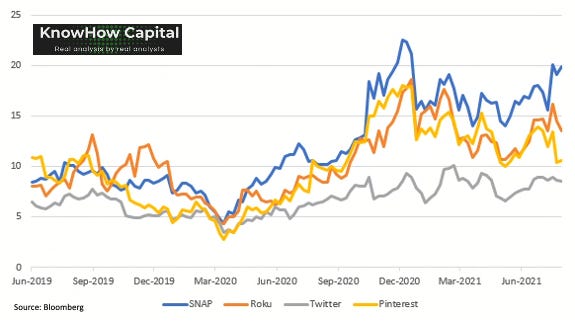
As you will see in the below chart, the different multiples that the market is assigning these four businesses suggests it is fixated on the shorter-term user metric. Across the whole equity universe, for a number of reasons, we are seeing an increasing focus from investors on shorter-term metrics. Sometimes, that is the correct approach, particularly in cyclical businesses. But, it can also present significant opportunities for those that are willing to be patient.


