In case you missed it...
Our analysis from this week
In case you missed some of our work this week, here’s a quick recap:
100 stocks most exposed to a retail unwind (Paid members only)
Dashing up… Food delivery remains robust
Where is the retail froth?
Copper, gold or rates… which is telling the truth?
The US dollar has further to fall
Growth reset done… Part I
Here is what’s in our pipeline for paid members. Don’t miss out. Subscribe Now
Stock screens for a growth bounce
Pinterest: evaluating the bear case
The Social in Sport: Nike, Adidas and Lululemon
100 stocks most exposed to a retail unwind
Our note and stock screen is now out for paying subscribers only. You can access is here.
We think this screen is important from a risk management perspective as retail activity remains concentrated in certain stocks and the risk of an unwind post re-opening remains high. We’ve considered three factors to build the database: liquidity, option activity and noise. If you’re a subscriber, feel free to send us your portfolio or key stocks and we’ll evaluate your retail exposure for you.
Dashing up… Food delivery remains robust
For those of you who have been with us since the early days, you will know we are positive on the food delivery names, despite increased competition and a potential post-pandemic fall in demand. You may also remember our original analysis on Uber (here). We think, the recent Door Dash results have given us a clearer understanding of a more normalised post pandemic food delivery environment.
Door Dash, the delivery app and platform company, reported that its 1Q gross order volume and revenues more than tripled. Not a huge surprise, given the lockdown in 1Q, BUT they continue to see strong demand despite re-opening.
A few points that make us incrementally more confident in the post-pandemic trading environment for delivery companies, including Uber Eats:
New customers average order rates AND customer order rates are higher than the pre-pandemic period. This gives us even more confidence that the pandemic has led to a step-change in consumer behaviour.
New customers continue to grow. Door Dash acquired new consumers at a pace that was consistent with the prior two quarters. Even as we leave lockdown, customer growth continues which again is supportive for the delivery names.
DashPass strength. Door Dash more than doubled DashPass subscribers Y/Y and drove DashPass average order frequency for the quarter to an all-time high since launch. As a reminder, Eats Pass offers a very a very similar offering and will benefit from a similar trend.
What does this mean for Uber?
The short conclusion is that Friday reassured us that the food delivery side of the Uber business will continue to perform well in the post-pandemic world. The positive order rate data gives us greater confidence in the step-change in consumer behaviour since the pandemic and while the summer months may see a downtick in orders, we are more confident that the delivery platforms, especially Door Dash and Uber Eats who are taking share (see below), are able to retain customers in their restaurant side of the business and drive further growth in new categories. On top of this, the upcoming launch of ‘everyday essentials’ should act as another catalyst for the Uber Eats side of the business.
Where is the retail froth?
We’re entering the summer lull. Earnings are largely out of the way and there are signs that volume is also starting to drop off. Forget what happened in 2020, this is typically a period where liquidity is key and you get some extreme pockets of volatility.
There is of course another dynamic at play here, different to pre-pandemic periods, and that is the retail investor. We discussed recently why it was important to measure retail investor activity (here). The Bank of International Settlements have also written on this recently, it’s worth a read, and the chart below is from their report. Retail flows are far more concentrated than the broader market and inevitably that adds to single-stock volatility.
The big question now is how sustainable this level of activity is. i.e. has the pandemic, government cash injections, time availability etc led to a structural shift in retail investor activity or will this unwind post-pandemic?
There are a couple of things worth tracking:
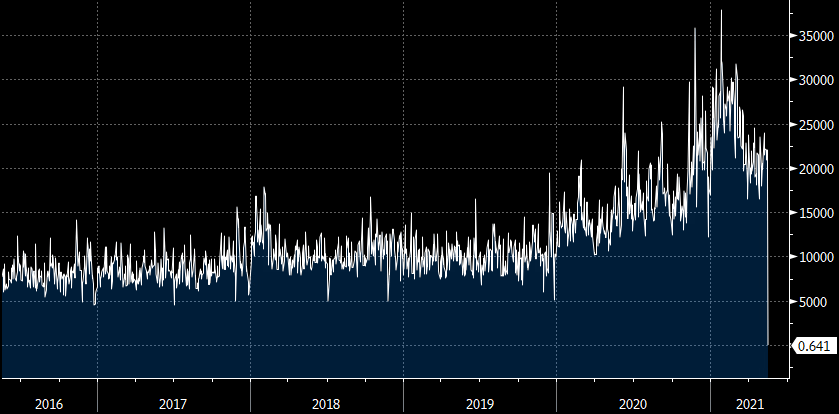
App downloads for investing had a pop post the Gamestop saga but have eased back again
We also like to look at call option activity. That too is showing signs of slowing.
Of course, all this could just be tied to the summer lull and the real picture will only be revealed later in the year when we track the higher comps. But, understand retail stocks concentration and positioning is key to help navigate any landmines over the coming weeks. Link to this week’s report is (here)
Copper, gold or rates… which is telling the truth?
If you look at the below chart of the copper-gold ratio vs US 10yr real rates, there has been a dislocation between copper, gold and real rates. This week, China’s credit impulse vs copper prices also attracted a lot of attention. These are all telling us different things. So, is copper too high, is gold too cheap or are real rates too low?
Why does the relationship matter?
Let’s start with why the relationship has held historically. Copper is an industrial metal driven by GDP growth. Gold is obviously a safe haven metal. A rising copper to gold ratio indicates improving industrial activity and should be in tandem with a pick-up in economic outlook and real rates expectations. However, there are different factors at play today that are skewing that relationship:
we are seeing a sharp post-recession re-stocking cycle for industrial and agricultural commodities. That means commodity inventories are tight and supply chains are under pressure.
gold has been facing competition from bitcoin as a potential safe haven /US dollar debasement asset.
the Fed is buying treasuries whilst other central banks and keeping rates artificially low.
Gold is cheap
So, what’s the right answer? In our view, the Fed is going nowhere anytime soon which means real rates remain anchored. Meanwhile, the recent volatility in bitcoin should then also support gold flows. That is already starting to happen. i.e. Gold is too cheap. But, it doesn’t stop there…
But, is copper in a speculation bubble?
If you have been a copper analyst over the past few years, two of your trading/tactical analytical tools have been CFTC Futures positioning and China Social Financing growth in shadow banking. China monetary growth has tended to drive speculative activity in copper, particularly through shadow banking i.e. outside traditional lenders. Today, CFTC non-commercial futures positioning, a good proxy for speculative flows is as high as its ever been. But, the shadow banking relationship has broken down as the Chinese government looks to clamp down.
When you put the two together, it suggests to us that speculative activity is being driven less by Chinese monetary flows with local authorities looking to limit price growth in key commodities. Instead, we think the current elevated futures positioning is driven more by stickier institutional flows. And, there is potentially very good reason for that as the CRU has been pointing out.
The US Dollar has further to fall
Just over a month ago we suggested that the USD could fall further. That has played out. But we think there is further to go.
After the Fed minutes this week, the US dollar initially ticked higher off the back of taper talk starting at upcoming meetings. However, timing here is important. The Fed minutes covered the April meeting. Since then, the most recent jobs data have been disappointing and will prevent the Fed from signalling tapering until Jackson Hole at the earliest in August.
Where Are We Now?
The move in yields has been relatively muted over the last month. Inflation remains the big near-term worry for investors, however the Fed has continuously reiterated that it will maintain its ultra-accommodative stance as it sees the inflationary pressures as transitory. The data will drive volatility clearly, but we see limited room for the 10yr yield to move materially above 2%. That means, real rates will remain anchored.
Europe is getting its act together
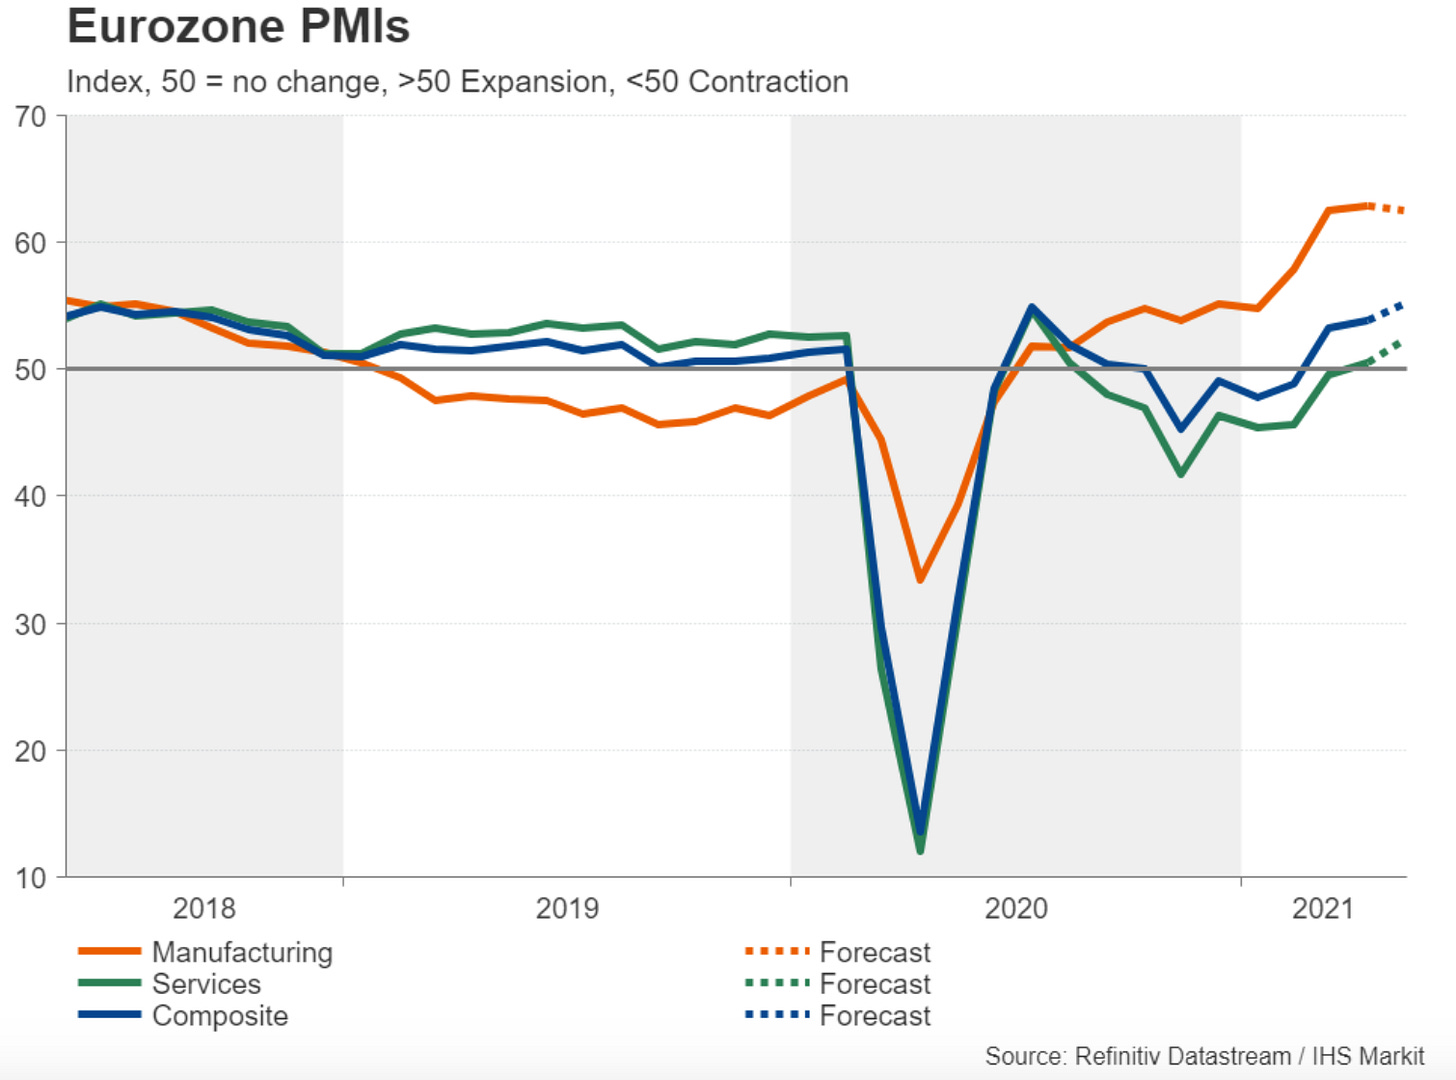
On top of the above, data momentum is swinging back to countries outside of the US. The Eurozone’s economic fortunes has re-energized euro bulls after a tough first quarter. Along with a weak technical picture, we struggle to see how the dollar doesn’t keep drifting lower.
Growth reset done… Part I
If you break down what drives stock prices, simplistically it is two things. The earnings trajectory of a business and the valuation or multiple the market is willing to assign that business. Nirvana is when we buy businesses on valuations and earnings that have substantial upside.
Rates matter during periods of uncertainty
Why do we obsess over rates and inflation expectations? Because it is a key input in market valuation. The chart below shows the correlation of the US 10yr yield vs the Nasdaq Comp PE multiple. If you have been obsessing over the US 10yr yield this year, appreciating the long-term correlation is important. Over the past few years, the correlation has almost always been negative i.e. rates go up multiples go down. Look out further and that has not always been the case.
The important point is this however… during periods of extreme valuation (low and high) and macro uncertainty, that relationship is highly negative. Those resets happen hard and fast.
Valuations have reset hard after recent volatility
Over the past week, that extreme negative correlation with multiples has started to ease. Yields have stabilised but as earnings upgrades have come through, so have valuations. The chart below would suggest that the valuation part of the growth reset is now largely complete. It’s over to earnings now.


